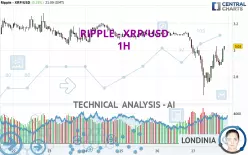
RIPPLE - XRP/USD - 1H - Technical analysis published on 01/27/2025 (GMT)
- 215
- 0
- Timeframe : 1H
- - Analysis generated on
- Status : NEUTRAL

Summary of the analysis

Additional analysis
Quotes
The RIPPLE - XRP/USD rating is 3.03 USD. On the day, this instrument gained +0.33% and was traded between 2.66 USD and 3.04 USD over the period. The price is currently at +13.91% from its lowest and -0.33% from its highest.The Central Gaps scanner detects a bullish opening. A small advantage for buyers in the very short term.
Bullish opening
Type : Bullish
Timeframe : Openning
Here is a more detailed summary of the historical variations registered by RIPPLE - XRP/USD:
Abnormal volumes
Timeframe : 5 days
Abnormal volumes
Timeframe : 20 days
Abnormal volumes
Timeframe : 50 days
Technical
Technical analysis of RIPPLE - XRP/USD in 1H shows an overall slightly bearish trend. Only 57.14% of the signals given by moving averages are bearish. This slightly bearish trend could turn neutral or reverse given the slightly bullish signals currently being given by short-term moving averages. The Central Indicators scanner detects bullish signals on moving averages that could impact this trend:
Bullish trend reversal : Moving Average 20
Type : Bullish
Timeframe : 1 hour
Bullish trend reversal : adaptative moving average 20
Type : Bullish
Timeframe : 1 hour
Bullish trend reversal : adaptative moving average 50
Type : Bullish
Timeframe : 1 hour
In fact, 14 technical indicators on 18 studied are currently positioned bullish. The Central Indicators scanner found no further results concerning independent technical indicators.
The analysis of the price chart with Central Patterns scanners does not return any result.
Central Candlesticks, the scanner specialised in Japanese candlesticks, detects a bearish signal that could support the hypothesis of a small drop in the very short term:
Bearish doji star
Type : Bearish
Timeframe : 1 hour
| S3 | S2 | S1 | Price | R1 | R2 | R3 | |
|---|---|---|---|---|---|---|---|
| ProTrendLines | 2.06 | 2.78 | 2.86 | 3.03 | 3.06 | 3.14 | 3.20 |
| Change (%) | -32.01% | -8.25% | -5.61% | - | +0.99% | +3.63% | +5.61% |
| Change | -0.97 | -0.25 | -0.17 | - | +0.03 | +0.11 | +0.17 |
| Level | Minor | Major | Minor | - | Intermediate | Minor | Minor |
To determine price objectives, it is also possible to use the pivot points. Here is the price position in relation to pivot points:
| Pivot points | S3 | S2 | S1 | PP | R1 | R2 | R3 |
|---|---|---|---|---|---|---|---|
| Standard | 2.84 | 2.93 | 2.97 | 3.06 | 3.10 | 3.19 | 3.23 |
| Camarilla | 2.98 | 3.00 | 3.01 | 3.02 | 3.03 | 3.04 | 3.06 |
| Woodie | 2.83 | 2.92 | 2.96 | 3.05 | 3.09 | 3.18 | 3.22 |
| Fibonacci | 2.93 | 2.98 | 3.01 | 3.06 | 3.11 | 3.14 | 3.19 |
| Pivot points | S3 | S2 | S1 | PP | R1 | R2 | R3 |
|---|---|---|---|---|---|---|---|
| Standard | 2.36 | 2.61 | 2.86 | 3.11 | 3.36 | 3.61 | 3.86 |
| Camarilla | 2.97 | 3.02 | 3.06 | 3.11 | 3.16 | 3.20 | 3.25 |
| Woodie | 2.36 | 2.61 | 2.86 | 3.11 | 3.36 | 3.61 | 3.86 |
| Fibonacci | 2.61 | 2.80 | 2.92 | 3.11 | 3.30 | 3.42 | 3.61 |
| Pivot points | S3 | S2 | S1 | PP | R1 | R2 | R3 |
|---|---|---|---|---|---|---|---|
| Standard | 0.91 | 1.41 | 1.74 | 2.24 | 2.57 | 3.07 | 3.40 |
| Camarilla | 1.85 | 1.93 | 2.00 | 2.08 | 2.16 | 2.23 | 2.31 |
| Woodie | 0.84 | 1.37 | 1.67 | 2.20 | 2.50 | 3.03 | 3.33 |
| Fibonacci | 1.41 | 1.72 | 1.92 | 2.24 | 2.55 | 2.75 | 3.07 |
Numerical data
The following are the details of the technical indicators and moving averages that were collected to generate this technical analysis:
| RSI (14): | 57.07 | |
| MACD (12,26,9): | -0.0200 | |
| Directional Movement: | 4.87 | |
| AROON (14): | 64.29 | |
| DEMA (21): | 2.91 | |
| Parabolic SAR (0,02-0,02-0,2): | 2.84 | |
| Elder Ray (13): | 0.08 | |
| Super Trend (3,10): | 2.82 | |
| Zig ZAG (10): | 3.02 | |
| VORTEX (21): | 1.0200 | |
| Stochastique (14,3,5): | 86.54 | |
| TEMA (21): | 2.93 | |
| Williams %R (14): | -5.22 | |
| Chande Momentum Oscillator (20): | 0.19 | |
| Repulse (5,40,3): | 2.5400 | |
| ROCnROLL: | 1 | |
| TRIX (15,9): | -0.2100 | |
| Courbe Coppock: | 4.59 |
| MA7: | 3.10 | |
| MA20: | 2.90 | |
| MA50: | 2.54 | |
| MA100: | 1.83 | |
| MAexp7: | 2.95 | |
| MAexp20: | 2.94 | |
| MAexp50: | 3.00 | |
| MAexp100: | 3.05 | |
| Price / MA7: | -2.26% | |
| Price / MA20: | +4.48% | |
| Price / MA50: | +19.29% | |
| Price / MA100: | +65.57% | |
| Price / MAexp7: | +2.71% | |
| Price / MAexp20: | +3.06% | |
| Price / MAexp50: | +1.00% | |
| Price / MAexp100: | -0.66% |
About author

Online


Add a comment
Comments
0 comments on the analysis RIPPLE - XRP/USD - 1H