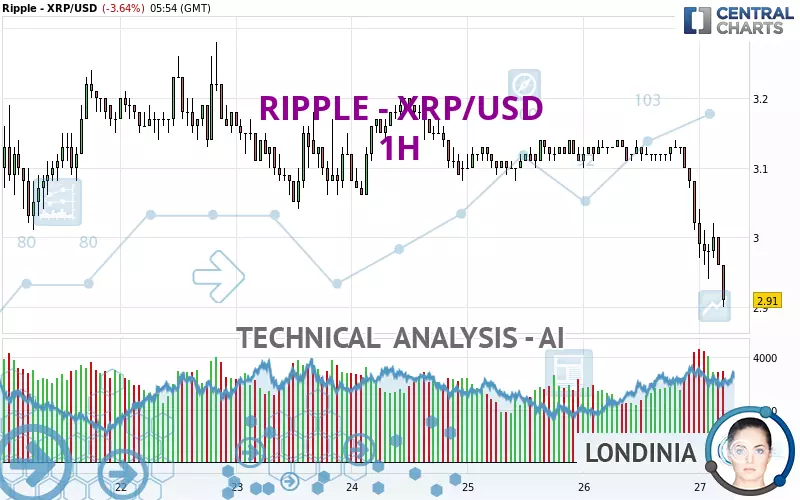
RIPPLE - XRP/USD - 1H - Technical analysis published on 01/27/2025 (GMT)
- 1176
- 0
Click here for a new analysis!
- Timeframe : 1H
- - Analysis generated on
- Status : TARGET REACHED
Summary of the analysis

Additional analysis
Quotes
The RIPPLE - XRP/USD rating is 2.91 USD. The price registered a decrease of -3.64% on the session with the lowest point at 2.90 USD and the highest point at 3.04 USD. The deviation from the price is +0.34% for the low point and -4.28% for the high point.A bullish opening was detected by the Central Gaps scanner. Buyers are trying to impose a bullish momentum in the very short term.
Bullish opening
Type : Bullish
Timeframe : Openning
Here is a more detailed summary of the historical variations registered by RIPPLE - XRP/USD:
Abnormal volumes
Timeframe : 20 days
Abnormal volumes
Timeframe : 50 days
Technical
Technical analysis of this 1H chart of RIPPLE - XRP/USD indicates that the overall trend is strongly bearish. 92.86% of the signals given by moving averages are bearish. This strongly bearish trend is supported by the strong bearish signals given by short-term moving averages. There is no crossing of moving average by the price or crossing of moving averages between themselves.
In fact, 13 technical indicators on 18 studied are currently positioned bearish. Caution: the Central Indicators scanner currently detects an excess:
RSI indicator is oversold : under 30
Type : Neutral
Timeframe : 1 hour
CCI indicator is oversold : under -100
Type : Neutral
Timeframe : 1 hour
CCI indicator: bullish divergence
Type : Bullish
Timeframe : 1 hour
RSI indicator: bullish divergence
Type : Bullish
Timeframe : 1 hour
Williams %R indicator is oversold : under -80
Type : Neutral
Timeframe : 1 hour
Pivot points : price is under support 1
Type : Neutral
Timeframe : 1 hour
Central Patterns, the scanner specializing in chart patterns, did not identify any signals.
For a small rebound in the very short term, the Central Candlesticks scanner currently notes the presence of this bullish pattern in Japanese candlesticks:
Bullish doji star
Type : Bullish
Timeframe : 1 hour
| S3 | S2 | S1 | Price | R1 | R2 | R3 | |
|---|---|---|---|---|---|---|---|
| ProTrendLines | 2.06 | 2.78 | 2.86 | 2.91 | 3.06 | 3.14 | 3.20 |
| Change (%) | -29.21% | -4.47% | -1.72% | - | +5.15% | +7.90% | +9.97% |
| Change | -0.85 | -0.13 | -0.05 | - | +0.15 | +0.23 | +0.29 |
| Level | Minor | Major | Minor | - | Intermediate | Minor | Minor |
Attention could also be paid to pivot points to set price objectives:
| Pivot points | S3 | S2 | S1 | PP | R1 | R2 | R3 |
|---|---|---|---|---|---|---|---|
| Standard | 2.84 | 2.93 | 2.97 | 3.06 | 3.10 | 3.19 | 3.23 |
| Camarilla | 2.98 | 3.00 | 3.01 | 3.02 | 3.03 | 3.04 | 3.06 |
| Woodie | 2.83 | 2.92 | 2.96 | 3.05 | 3.09 | 3.18 | 3.22 |
| Fibonacci | 2.93 | 2.98 | 3.01 | 3.06 | 3.11 | 3.14 | 3.19 |
| Pivot points | S3 | S2 | S1 | PP | R1 | R2 | R3 |
|---|---|---|---|---|---|---|---|
| Standard | 2.36 | 2.61 | 2.86 | 3.11 | 3.36 | 3.61 | 3.86 |
| Camarilla | 2.97 | 3.02 | 3.06 | 3.11 | 3.16 | 3.20 | 3.25 |
| Woodie | 2.36 | 2.61 | 2.86 | 3.11 | 3.36 | 3.61 | 3.86 |
| Fibonacci | 2.61 | 2.80 | 2.92 | 3.11 | 3.30 | 3.42 | 3.61 |
| Pivot points | S3 | S2 | S1 | PP | R1 | R2 | R3 |
|---|---|---|---|---|---|---|---|
| Standard | 0.91 | 1.41 | 1.74 | 2.24 | 2.57 | 3.07 | 3.40 |
| Camarilla | 1.85 | 1.93 | 2.00 | 2.08 | 2.16 | 2.23 | 2.31 |
| Woodie | 0.84 | 1.37 | 1.67 | 2.20 | 2.50 | 3.03 | 3.33 |
| Fibonacci | 1.41 | 1.72 | 1.92 | 2.24 | 2.55 | 2.75 | 3.07 |
Numerical data
The following are the details of the technical indicators and moving averages that were collected to generate this technical analysis:
| RSI (14): | 22.39 | |
| MACD (12,26,9): | -0.0400 | |
| Directional Movement: | -27.74 | |
| AROON (14): | -50.00 | |
| DEMA (21): | 3.00 | |
| Parabolic SAR (0,02-0,02-0,2): | 3.05 | |
| Elder Ray (13): | -0.07 | |
| Super Trend (3,10): | 3.05 | |
| Zig ZAG (10): | 2.94 | |
| VORTEX (21): | 0.6600 | |
| Stochastique (14,3,5): | 15.09 | |
| TEMA (21): | 2.97 | |
| Williams %R (14): | -90.22 | |
| Chande Momentum Oscillator (20): | -0.17 | |
| Repulse (5,40,3): | -1.7100 | |
| ROCnROLL: | 2 | |
| TRIX (15,9): | -0.1200 | |
| Courbe Coppock: | 8.53 |
| MA7: | 3.09 | |
| MA20: | 2.90 | |
| MA50: | 2.54 | |
| MA100: | 1.83 | |
| MAexp7: | 2.99 | |
| MAexp20: | 3.05 | |
| MAexp50: | 3.09 | |
| MAexp100: | 3.11 | |
| Price / MA7: | -5.83% | |
| Price / MA20: | +0.34% | |
| Price / MA50: | +14.57% | |
| Price / MA100: | +59.02% | |
| Price / MAexp7: | -2.68% | |
| Price / MAexp20: | -4.59% | |
| Price / MAexp50: | -5.83% | |
| Price / MAexp100: | -6.43% |
About author

Online


Add a comment
Comments
0 comments on the analysis RIPPLE - XRP/USD - 1H