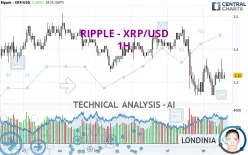
RIPPLE - XRP/USD - 1H - Technical analysis published on 01/08/2025 (GMT)
- 293
- 0
Click here for a new analysis!
- Timeframe : 1H
- - Analysis generated on
- Status : TARGET REACHED

Summary of the analysis

Additional analysis
Quotes
RIPPLE - XRP/USD rating 2.32 USD. On the day, this instrument gained +2.20% and was between 2.26 USD and 2.37 USD. This implies that the price is at +2.65% from its lowest and at -2.11% from its highest.The Central Gaps scanner detects a bullish opening. A small advantage for buyers in the very short term.
Bullish opening
Type : Bullish
Timeframe : Openning
Here is a more detailed summary of the historical variations registered by RIPPLE - XRP/USD:
Abnormal volumes
Timeframe : 20 days
Abnormal volumes
Timeframe : 50 days
Technical
Technical analysis of this 1H chart of RIPPLE - XRP/USD indicates that the overall trend is bearish. 75.00% of the signals given by moving averages are bearish. Caution: as the signals currently given by short-term moving averages are rather neutral, the bearish trend could slow down. An assessment of moving averages reveals a bullish signal that could impact this trend:
Bullish price crossover with adaptative moving average 20
Type : Bullish
Timeframe : 1 hour
In fact, according to the parameters integrated into the Central Analyzer system, only 7 technical indicators out of 18 analysed are currently bullish. Central Indicators, the detector scanner for these technical indicators has recently detected several signals:
RSI indicator is back over 50
Type : Bullish
Timeframe : 1 hour
Williams %R indicator is back over -50
Type : Bullish
Timeframe : 1 hour
An analysis of the price chart with the Central Patterns scanner (detector of chart patterns and resistances and supports) shows several results that can have an impact on the price change:
Near horizontal resistance
Type : Bearish
Timeframe : 1 hour
Near support of triangle
Type : Bullish
Timeframe : 1 hour
The Central Candlesticks scanner which studies Japanese candlesticks did not detect anything.
| S3 | S2 | S1 | Price | R1 | R2 | R3 | |
|---|---|---|---|---|---|---|---|
| ProTrendLines | 2.15 | 2.26 | 2.32 | 2.32 | 2.39 | 2.47 | 2.51 |
| Change (%) | -7.33% | -2.59% | 0% | - | +3.02% | +6.47% | +8.19% |
| Change | -0.17 | -0.06 | 0 | - | +0.07 | +0.15 | +0.19 |
| Level | Major | Minor | Major | - | Minor | Intermediate | Minor |
To determine price objectives, it is also possible to use the pivot points. Here is the price position in relation to pivot points:
| Pivot points | S3 | S2 | S1 | PP | R1 | R2 | R3 |
|---|---|---|---|---|---|---|---|
| Standard | 1.99 | 2.12 | 2.20 | 2.33 | 2.41 | 2.54 | 2.62 |
| Camarilla | 2.21 | 2.23 | 2.25 | 2.27 | 2.29 | 2.31 | 2.33 |
| Woodie | 1.96 | 2.11 | 2.17 | 2.32 | 2.38 | 2.53 | 2.59 |
| Fibonacci | 2.12 | 2.20 | 2.25 | 2.33 | 2.41 | 2.46 | 2.54 |
| Pivot points | S3 | S2 | S1 | PP | R1 | R2 | R3 |
|---|---|---|---|---|---|---|---|
| Standard | 1.58 | 1.79 | 2.10 | 2.31 | 2.62 | 2.83 | 3.14 |
| Camarilla | 2.28 | 2.33 | 2.37 | 2.42 | 2.47 | 2.52 | 2.56 |
| Woodie | 1.64 | 1.82 | 2.16 | 2.34 | 2.68 | 2.86 | 3.20 |
| Fibonacci | 1.79 | 1.99 | 2.11 | 2.31 | 2.51 | 2.63 | 2.83 |
| Pivot points | S3 | S2 | S1 | PP | R1 | R2 | R3 |
|---|---|---|---|---|---|---|---|
| Standard | 0.62 | 1.23 | 1.66 | 2.27 | 2.70 | 3.31 | 3.74 |
| Camarilla | 1.79 | 1.89 | 1.99 | 2.08 | 2.18 | 2.27 | 2.37 |
| Woodie | 0.52 | 1.19 | 1.56 | 2.23 | 2.60 | 3.27 | 3.64 |
| Fibonacci | 1.23 | 1.63 | 1.88 | 2.27 | 2.67 | 2.92 | 3.31 |
Numerical data
The following are the details of the technical indicators and moving averages that were collected to generate this technical analysis:
| RSI (14): | 47.51 | |
| MACD (12,26,9): | -0.0100 | |
| Directional Movement: | 3.85 | |
| AROON (14): | 35.71 | |
| DEMA (21): | 2.30 | |
| Parabolic SAR (0,02-0,02-0,2): | 2.26 | |
| Elder Ray (13): | 0 | |
| Super Trend (3,10): | 2.39 | |
| Zig ZAG (10): | 2.32 | |
| VORTEX (21): | 1.0300 | |
| Stochastique (14,3,5): | 49.42 | |
| TEMA (21): | 2.31 | |
| Williams %R (14): | -45.48 | |
| Chande Momentum Oscillator (20): | -0.01 | |
| Repulse (5,40,3): | -0.5700 | |
| ROCnROLL: | -1 | |
| TRIX (15,9): | -0.1200 | |
| Courbe Coppock: | 1.14 |
| MA7: | 2.38 | |
| MA20: | 2.26 | |
| MA50: | 2.15 | |
| MA100: | 1.38 | |
| MAexp7: | 2.32 | |
| MAexp20: | 2.32 | |
| MAexp50: | 2.35 | |
| MAexp100: | 2.36 | |
| Price / MA7: | -2.52% | |
| Price / MA20: | +2.65% | |
| Price / MA50: | +7.91% | |
| Price / MA100: | +68.12% | |
| Price / MAexp7: | -0% | |
| Price / MAexp20: | -0% | |
| Price / MAexp50: | -1.28% | |
| Price / MAexp100: | -1.69% |
About author
Online


Add a comment
Comments
0 comments on the analysis RIPPLE - XRP/USD - 1H