RIPPLE - XRP/USD - 1H - Technical analysis published on 12/04/2024 (GMT)
- 175
- 0
Click here for a new analysis!
- Timeframe : 1H
- - Analysis generated on
- Status : TARGET REACHED
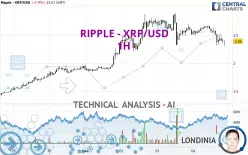

Summary of the analysis

Additional analysis
Quotes
The RIPPLE - XRP/USD rating is 2.39 USD. On the day, this instrument lost -4.78% and was between 2.30 USD and 2.67 USD. This implies that the price is at +3.91% from its lowest and at -10.49% from its highest.The Central Gaps scanner detects a bearish opening marking the presence of sellers ahead of buyers at the opening but not sufficiently marked to allow the price to register a quotation gap.
Bearish opening
Type : Bearish
Timeframe : Openning
So that you have an overall view of the price change, here is a table showing the variations over several periods:
New HIGH record (5 years)
Type : Bullish
Timeframe : Weekly
The Central Volumes scanner detects abnormal volumes on the asset:
Abnormal volumes
Timeframe : 5 days
Abnormal volumes
Timeframe : 20 days
Abnormal volumes
Timeframe : 50 days
Technical
Technical analysis of RIPPLE - XRP/USD in 1H shows an overall slightly bearish trend. 60.71% of the signals given by moving averages are bearish. The overall trend could accelerate as a result of the strong bearish signals from short-term moving averages. The Central Indicators scanner detects a bearish signal on moving averages that could impact this trend:
Bearish price crossover with Moving Average 100
Type : Bearish
Timeframe : 1 hour
In fact, 12 technical indicators on 18 studied are currently positioned bearish. Caution: the Central Indicators scanner currently detects an excess:
CCI indicator is oversold : under -100
Type : Neutral
Timeframe : 1 hour
RSI indicator: bullish divergence
Type : Bullish
Timeframe : 1 hour
Williams %R indicator is oversold : under -80
Type : Neutral
Timeframe : 1 hour
Pivot points : price is over resistance 1
Type : Neutral
Timeframe : Weekly
No signals are given by Central Patterns, a market scanner specialised in chart patterns, resistances and supports.
No result was found by the Central Candlesticks scanner on Japanese candlesticks.
| S3 | S2 | S1 | Price | R1 | R2 | |
|---|---|---|---|---|---|---|
| ProTrendLines | 1.39 | 1.84 | 2.32 | 2.39 | 2.50 | 2.78 |
| Change (%) | -41.84% | -23.01% | -2.93% | - | +4.60% | +16.32% |
| Change | -1.00 | -0.55 | -0.07 | - | +0.11 | +0.39 |
| Level | Major | Major | Intermediate | - | Minor | Major |
Pivot points can also be used to set your price objectives. Here is the price situation in relation to pivot points:
| Pivot points | S3 | S2 | S1 | PP | R1 | R2 | R3 |
|---|---|---|---|---|---|---|---|
| Standard | 1.69 | 2.00 | 2.26 | 2.57 | 2.83 | 3.14 | 3.40 |
| Camarilla | 2.35 | 2.41 | 2.46 | 2.51 | 2.56 | 2.62 | 2.67 |
| Woodie | 1.66 | 1.99 | 2.23 | 2.56 | 2.80 | 3.13 | 3.37 |
| Fibonacci | 2.00 | 2.22 | 2.36 | 2.57 | 2.79 | 2.93 | 3.14 |
| Pivot points | S3 | S2 | S1 | PP | R1 | R2 | R3 |
|---|---|---|---|---|---|---|---|
| Standard | 0.84 | 1.06 | 1.51 | 1.73 | 2.18 | 2.40 | 2.85 |
| Camarilla | 1.77 | 1.83 | 1.89 | 1.95 | 2.01 | 2.07 | 2.13 |
| Woodie | 0.95 | 1.12 | 1.62 | 1.79 | 2.29 | 2.46 | 2.96 |
| Fibonacci | 1.06 | 1.32 | 1.48 | 1.73 | 1.99 | 2.15 | 2.40 |
| Pivot points | S3 | S2 | S1 | PP | R1 | R2 | R3 |
|---|---|---|---|---|---|---|---|
| Standard | -0.50 | 0.00 | 0.97 | 1.47 | 2.44 | 2.94 | 3.91 |
| Camarilla | 1.55 | 1.68 | 1.82 | 1.95 | 2.09 | 2.22 | 2.35 |
| Woodie | -0.26 | 0.12 | 1.22 | 1.59 | 2.69 | 3.06 | 4.16 |
| Fibonacci | 0.00 | 0.56 | 0.91 | 1.47 | 2.03 | 2.38 | 2.94 |
Numerical data
The following is the status of technical indicators and moving averages registered at the time this technical analysis was created:
| RSI (14): | 34.81 | |
| MACD (12,26,9): | -0.0500 | |
| Directional Movement: | -13.34 | |
| AROON (14): | -57.15 | |
| DEMA (21): | 2.44 | |
| Parabolic SAR (0,02-0,02-0,2): | 2.63 | |
| Elder Ray (13): | -0.10 | |
| Super Trend (3,10): | 2.60 | |
| Zig ZAG (10): | 2.33 | |
| VORTEX (21): | 0.8700 | |
| Stochastique (14,3,5): | 15.96 | |
| TEMA (21): | 2.38 | |
| Williams %R (14): | -86.54 | |
| Chande Momentum Oscillator (20): | -0.29 | |
| Repulse (5,40,3): | -3.2500 | |
| ROCnROLL: | 2 | |
| TRIX (15,9): | -0.1600 | |
| Courbe Coppock: | 13.91 |
| MA7: | 2.17 | |
| MA20: | 1.58 | |
| MA50: | 0.96 | |
| MA100: | 0.76 | |
| MAexp7: | 2.42 | |
| MAexp20: | 2.50 | |
| MAexp50: | 2.51 | |
| MAexp100: | 2.37 | |
| Price / MA7: | +10.14% | |
| Price / MA20: | +51.27% | |
| Price / MA50: | +148.96% | |
| Price / MA100: | +214.47% | |
| Price / MAexp7: | -1.24% | |
| Price / MAexp20: | -4.40% | |
| Price / MAexp50: | -4.78% | |
| Price / MAexp100: | +0.84% |
About author

Online


Add a comment
Comments
0 comments on the analysis RIPPLE - XRP/USD - 1H