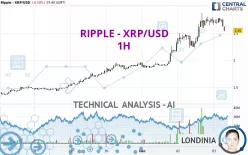
RIPPLE - XRP/USD - 1H - Technical analysis published on 12/03/2024 (GMT)
- 1103
- 0
Click here for a new analysis!
- Timeframe : 1H
- - Analysis generated on
- Status : INVALID

Summary of the analysis

Additional analysis
Quotes
The RIPPLE - XRP/USD price is 2.55 USD. On the day, this instrument lost -6.59% and was between 2.53 USD and 2.77 USD. This implies that the price is at +0.79% from its lowest and at -7.94% from its highest.The Central Gaps scanner detects a bullish opening. A small advantage for buyers in the very short term.
Bullish opening
Type : Bullish
Timeframe : Openning
Here is a more detailed summary of the historical variations registered by RIPPLE - XRP/USD:
New HIGH record (5 years)
Type : Bullish
Timeframe : Weekly
Near a new HIGH record (1 year)
Type : Bullish
Timeframe : Weekly
Near a new HIGH record (1 month)
Type : Bullish
Timeframe : Weekly
The Central Volumes scanner detects abnormal volumes on the asset:
Abnormal volumes
Timeframe : 5 days
Abnormal volumes
Timeframe : 20 days
Abnormal volumes
Timeframe : 50 days
Technical
A technical analysis in 1H of this RIPPLE - XRP/USD chart shows a bullish trend. 75.00% of the signals given by moving averages are bullish. Caution: the neutral signals currently given by the short-term moving averages indicate that this bullish trend is showing signs of running out of steam. The Central Indicators market scanner is currently detecting several bearish signals that could impact this trend:
Bearish trend reversal : adaptative moving average 20
Type : Bearish
Timeframe : 1 hour
Bearish price crossover with adaptative moving average 20
Type : Bearish
Timeframe : 1 hour
Bearish price crossover with adaptative moving average 50
Type : Bearish
Timeframe : 1 hour
Bearish price crossover with adaptative moving average 100
Type : Bearish
Timeframe : 1 hour
In fact, according to the parameters integrated into the Central Analyzer system, only 7 technical indicators out of 18 analysed are currently bearish. Caution: the Central Indicators scanner currently detects an excess:
Williams %R indicator is oversold : under -80
Type : Neutral
Timeframe : 1 hour
Pivot points : price is over resistance 2
Type : Neutral
Timeframe : Weekly
RSI indicator is back under 50
Type : Bearish
Timeframe : 1 hour
Parabolic SAR indicator bearish reversal
Type : Bearish
Timeframe : 1 hour
The Central Patterns scanner, which studies chart patterns, resistances and supports, has identified this signal:
Support of channel is broken
Type : Bearish
Timeframe : 1 hour
The Central Candlesticks scanner which studies Japanese candlesticks did not detect anything.
| S3 | S2 | S1 | Price | R1 | |
|---|---|---|---|---|---|
| ProTrendLines | 1.84 | 2.22 | 2.50 | 2.55 | 2.78 |
| Change (%) | -27.84% | -12.94% | -1.96% | - | +9.02% |
| Change | -0.71 | -0.33 | -0.05 | - | +0.23 |
| Level | Major | Intermediate | Minor | - | Major |
Attention could also be paid to pivot points to set price objectives:
| Pivot points | S3 | S2 | S1 | PP | R1 | R2 | R3 |
|---|---|---|---|---|---|---|---|
| Standard | 1.69 | 1.96 | 2.34 | 2.61 | 2.99 | 3.26 | 3.64 |
| Camarilla | 2.55 | 2.61 | 2.67 | 2.73 | 2.79 | 2.85 | 2.91 |
| Woodie | 1.76 | 1.99 | 2.41 | 2.64 | 3.06 | 3.29 | 3.71 |
| Fibonacci | 1.96 | 2.21 | 2.36 | 2.61 | 2.86 | 3.01 | 3.26 |
| Pivot points | S3 | S2 | S1 | PP | R1 | R2 | R3 |
|---|---|---|---|---|---|---|---|
| Standard | 0.84 | 1.06 | 1.51 | 1.73 | 2.18 | 2.40 | 2.85 |
| Camarilla | 1.77 | 1.83 | 1.89 | 1.95 | 2.01 | 2.07 | 2.13 |
| Woodie | 0.95 | 1.12 | 1.62 | 1.79 | 2.29 | 2.46 | 2.96 |
| Fibonacci | 1.06 | 1.32 | 1.48 | 1.73 | 1.99 | 2.15 | 2.40 |
| Pivot points | S3 | S2 | S1 | PP | R1 | R2 | R3 |
|---|---|---|---|---|---|---|---|
| Standard | -0.50 | 0.00 | 0.97 | 1.47 | 2.44 | 2.94 | 3.91 |
| Camarilla | 1.55 | 1.68 | 1.82 | 1.95 | 2.09 | 2.22 | 2.35 |
| Woodie | -0.26 | 0.12 | 1.22 | 1.59 | 2.69 | 3.06 | 4.16 |
| Fibonacci | 0.00 | 0.56 | 0.91 | 1.47 | 2.03 | 2.38 | 2.94 |
Numerical data
The following are the details of the technical indicators and moving averages that were collected to generate this technical analysis:
| RSI (14): | 48.69 | |
| MACD (12,26,9): | 0.0800 | |
| Directional Movement: | 1.50 | |
| AROON (14): | -78.57 | |
| DEMA (21): | 2.76 | |
| Parabolic SAR (0,02-0,02-0,2): | 2.87 | |
| Elder Ray (13): | -0.09 | |
| Super Trend (3,10): | 2.44 | |
| Zig ZAG (10): | 2.54 | |
| VORTEX (21): | 1.1000 | |
| Stochastique (14,3,5): | 29.25 | |
| TEMA (21): | 2.72 | |
| Williams %R (14): | -85.48 | |
| Chande Momentum Oscillator (20): | -0.18 | |
| Repulse (5,40,3): | -4.9900 | |
| ROCnROLL: | -1 | |
| TRIX (15,9): | 0.7100 | |
| Courbe Coppock: | 7.09 |
| MA7: | 2.05 | |
| MA20: | 1.50 | |
| MA50: | 0.93 | |
| MA100: | 0.74 | |
| MAexp7: | 2.66 | |
| MAexp20: | 2.63 | |
| MAexp50: | 2.41 | |
| MAexp100: | 2.17 | |
| Price / MA7: | +24.39% | |
| Price / MA20: | +70.00% | |
| Price / MA50: | +174.19% | |
| Price / MA100: | +244.59% | |
| Price / MAexp7: | -4.14% | |
| Price / MAexp20: | -3.04% | |
| Price / MAexp50: | +5.81% | |
| Price / MAexp100: | +17.51% |
About author

Online


Add a comment
Comments
0 comments on the analysis RIPPLE - XRP/USD - 1H