BANCOR NETWORK TOKEN - BNT/USD - 1H - Technical analysis published on 01/19/2025 (GMT)
- 98
- 0
- Timeframe : 1H
- - Analysis generated on
- Status : NEUTRAL
Summary of the analysis

Additional analysis
Quotes
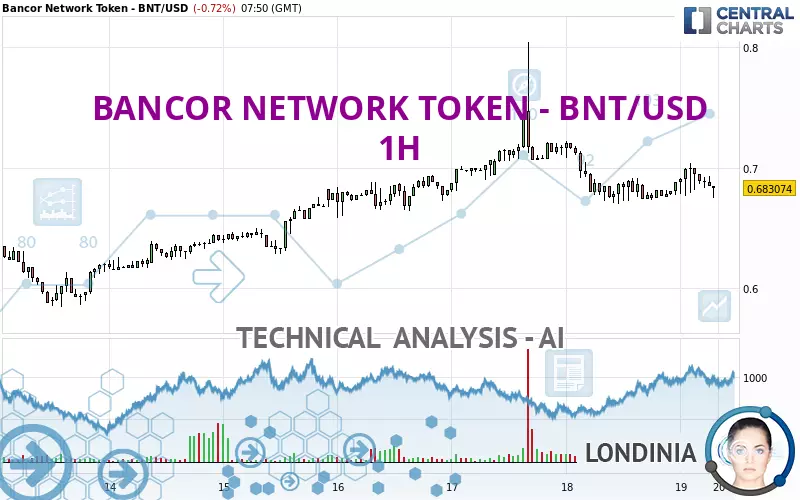
BANCOR NETWORK TOKEN - BNT/USD rating 0.683074 USD. On the day, this instrument lost -0.72% with the lowest point at 0.675117 USD and the highest point at 0.704160 USD. The deviation from the price is +1.18% for the low point and -2.99% for the high point.A bearish opening was detected by the Central Gaps scanner. Sellers are trying to impose a bearish trend in the very short term.
Bullish opening
Type : Bullish
Timeframe : Openning
Bearish opening
Type : Bearish
Timeframe : Openning
A study of price movements over other periods shows the following variations:
New HIGH record (1st january)
Type : Bullish
Timeframe : Weekly
Technical
Technical analysis of this 1H chart of BANCOR NETWORK TOKEN - BNT/USD indicates that the overall trend is not clearly defined. This indecision could turn into a bearish trend due to the slightly bearish signals currently given by short-term moving averages. The Central Indicators scanner detects a bearish signal on moving averages that could impact this trend:
Bearish price crossover with Moving Average 100
Type : Bearish
Timeframe : 1 hour
An assessment of technical indicators does not currently provide any relevant information on the direction of future price movements.
Other results related to technical indicators were also found by the Central Indicators scanner:
Pivot points : price is over resistance 2
Type : Neutral
Timeframe : 1 hour
Parabolic SAR indicator bearish reversal
Type : Bearish
Timeframe : 1 hour
No signals are given by Central Patterns, a market scanner specialised in chart patterns, resistances and supports.
Central Candlesticks, the scanner specialised in Japanese candlesticks, detects this inversion signal that could impact the current short-term trend:
Black hanging man / hammer
Type : Neutral
Timeframe : 1 hour
| S3 | S2 | S1 | Price | R1 | R2 | R3 | |
|---|---|---|---|---|---|---|---|
| ProTrendLines | 0.611889 | 0.633629 | 0.652536 | 0.683074 | 0.721438 | 0.739037 | 0.795164 |
| Change (%) | -10.42% | -7.24% | -4.47% | - | +5.62% | +8.19% | +16.41% |
| Change | -0.071185 | -0.049445 | -0.030538 | - | +0.038364 | +0.055963 | +0.112090 |
| Level | Minor | Minor | Intermediate | - | Major | Intermediate | Intermediate |
Pivot points can also be used to set your price objectives. Here is the price situation in relation to pivot points:
| Pivot points | S3 | S2 | S1 | PP | R1 | R2 | R3 |
|---|---|---|---|---|---|---|---|
| Standard | 0.612430 | 0.641074 | 0.664550 | 0.693194 | 0.716670 | 0.745314 | 0.768790 |
| Camarilla | 0.673693 | 0.678471 | 0.683248 | 0.688026 | 0.692804 | 0.697581 | 0.702359 |
| Woodie | 0.609846 | 0.639782 | 0.661966 | 0.691902 | 0.714086 | 0.744022 | 0.766206 |
| Fibonacci | 0.641074 | 0.660984 | 0.673284 | 0.693194 | 0.713104 | 0.725404 | 0.745314 |
| Pivot points | S3 | S2 | S1 | PP | R1 | R2 | R3 |
|---|---|---|---|---|---|---|---|
| Standard | 0.360693 | 0.472592 | 0.580309 | 0.692208 | 0.799925 | 0.911824 | 1.019541 |
| Camarilla | 0.627632 | 0.647763 | 0.667895 | 0.688026 | 0.708158 | 0.728289 | 0.748420 |
| Woodie | 0.358602 | 0.471547 | 0.578218 | 0.691163 | 0.797834 | 0.910779 | 1.017450 |
| Fibonacci | 0.472592 | 0.556485 | 0.608315 | 0.692208 | 0.776101 | 0.827931 | 0.911824 |
| Pivot points | S3 | S2 | S1 | PP | R1 | R2 | R3 |
|---|---|---|---|---|---|---|---|
| Standard | 0.169587 | 0.387058 | 0.520938 | 0.738409 | 0.872289 | 1.089760 | 1.223640 |
| Camarilla | 0.558198 | 0.590405 | 0.622612 | 0.654819 | 0.687026 | 0.719233 | 0.751441 |
| Woodie | 0.127793 | 0.366160 | 0.479144 | 0.717511 | 0.830495 | 1.068862 | 1.181846 |
| Fibonacci | 0.387058 | 0.521274 | 0.604193 | 0.738409 | 0.872625 | 0.955544 | 1.089760 |
Numerical data
The following is the status of the technical indicators and moving averages at the time of publication of this technical analysis:
| RSI (14): | 46.58 | |
| MACD (12,26,9): | -0.0009 | |
| Directional Movement: | 7.764488 | |
| AROON (14): | 57.142857 | |
| DEMA (21): | 0.685711 | |
| Parabolic SAR (0,02-0,02-0,2): | 0.704160 | |
| Elder Ray (13): | -0.003737 | |
| Super Trend (3,10): | 0.708003 | |
| Zig ZAG (10): | 0.682439 | |
| VORTEX (21): | 1.0478 | |
| Stochastique (14,3,5): | 38.97 | |
| TEMA (21): | 0.686865 | |
| Williams %R (14): | -68.91 | |
| Chande Momentum Oscillator (20): | 0.001650 | |
| Repulse (5,40,3): | -0.5157 | |
| ROCnROLL: | 2 | |
| TRIX (15,9): | -0.0479 | |
| Courbe Coppock: | 2.73 |
| MA7: | 0.672601 | |
| MA20: | 0.677713 | |
| MA50: | 0.748988 | |
| MA100: | 0.661349 | |
| MAexp7: | 0.687551 | |
| MAexp20: | 0.688009 | |
| MAexp50: | 0.688929 | |
| MAexp100: | 0.681198 | |
| Price / MA7: | +1.56% | |
| Price / MA20: | +0.79% | |
| Price / MA50: | -8.80% | |
| Price / MA100: | +3.28% | |
| Price / MAexp7: | -0.65% | |
| Price / MAexp20: | -0.72% | |
| Price / MAexp50: | -0.85% | |
| Price / MAexp100: | +0.28% |
About author
Online


Add a comment
Comments
0 comments on the analysis BANCOR NETWORK TOKEN - BNT/USD - 1H