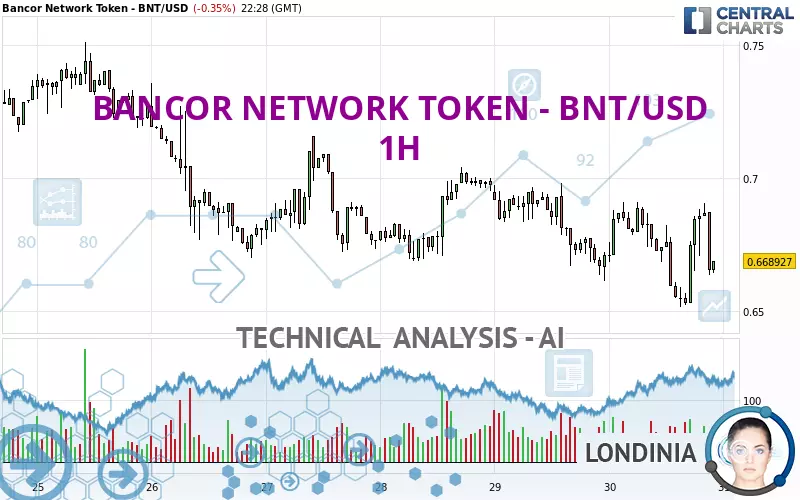
BANCOR NETWORK TOKEN - BNT/USD - 1H - Technical analysis published on 12/30/2024 (GMT)
- 108
- 0
Click here for a new analysis!
- Timeframe : 1H
- - Analysis generated on
- Status : LEVEL MAINTAINED
Summary of the analysis

Additional analysis
Quotes
BANCOR NETWORK TOKEN - BNT/USD rating 0.668927 USD. The price is lower by -0.35% since the last closing and was between 0.651616 USD and 0.691244 USD. This implies that the price is at +2.66% from its lowest and at -3.23% from its highest.The Central Gaps scanner detects a bearish opening. A small advantage for sellers in the very short term.
Bearish opening
Type : Bearish
Timeframe : Openning
A study of price movements over other periods shows the following variations:
New LOW record (1st january)
Type : Bearish
Timeframe : Weekly
Technical
A technical analysis in 1H of this BANCOR NETWORK TOKEN - BNT/USD chart shows a sharp bearish trend. 92.86% of the signals given by moving averages are bearish. The overall trend is supported by the strong bearish signals from short-term moving averages. The Central Indicators scanner detects bearish signals on moving averages that could impact this trend:
Bearish trend reversal : Moving Average 20
Type : Bearish
Timeframe : 1 hour
Bearish trend reversal : adaptative moving average 20
Type : Bearish
Timeframe : 1 hour
Bearish trend reversal : adaptative moving average 50
Type : Bearish
Timeframe : 1 hour
Bearish trend reversal : adaptative moving average 100
Type : Bearish
Timeframe : 1 hour
An assessment of technical indicators does not currently provide any relevant information on the direction of future price movements.
Central Indicators, the scanner specialised in technical indicators, has identified this signal:
Price is back under the pivot point
Type : Bearish
Timeframe : 1 hour
An analysis of the price chart with the Central Patterns scanner (detector of chart patterns and resistances and supports) shows a result that can have an impact on the price change:
Near support of triangle
Type : Bullish
Timeframe : 1 hour
No result was found by the Central Candlesticks scanner on Japanese candlesticks.
| S3 | S2 | S1 | Price | R1 | R2 | R3 | |
|---|---|---|---|---|---|---|---|
| ProTrendLines | 0.543441 | 0.604528 | 0.668875 | 0.668927 | 0.690559 | 0.716239 | 0.733594 |
| Change (%) | -18.76% | -9.63% | -0.01% | - | +3.23% | +7.07% | +9.67% |
| Change | -0.125486 | -0.064399 | -0.000052 | - | +0.021632 | +0.047312 | +0.064667 |
| Level | Major | Minor | Major | - | Intermediate | Intermediate | Minor |
Pivot points can also be used to set your price objectives. Here is the price situation in relation to pivot points:
| Pivot points | S3 | S2 | S1 | PP | R1 | R2 | R3 |
|---|---|---|---|---|---|---|---|
| Standard | 0.619272 | 0.640395 | 0.655836 | 0.676959 | 0.692400 | 0.713523 | 0.728964 |
| Camarilla | 0.661223 | 0.664575 | 0.667926 | 0.671278 | 0.674630 | 0.677981 | 0.681333 |
| Woodie | 0.616432 | 0.638975 | 0.652996 | 0.675539 | 0.689560 | 0.712103 | 0.726124 |
| Fibonacci | 0.640395 | 0.654362 | 0.662991 | 0.676959 | 0.690926 | 0.699555 | 0.713523 |
| Pivot points | S3 | S2 | S1 | PP | R1 | R2 | R3 |
|---|---|---|---|---|---|---|---|
| Standard | 0.543068 | 0.595463 | 0.646526 | 0.698921 | 0.749984 | 0.802379 | 0.853442 |
| Camarilla | 0.669138 | 0.678622 | 0.688105 | 0.697589 | 0.707073 | 0.716556 | 0.726040 |
| Woodie | 0.542402 | 0.595130 | 0.645860 | 0.698588 | 0.749318 | 0.802046 | 0.852776 |
| Fibonacci | 0.595463 | 0.634984 | 0.659400 | 0.698921 | 0.738442 | 0.762858 | 0.802379 |
| Pivot points | S3 | S2 | S1 | PP | R1 | R2 | R3 |
|---|---|---|---|---|---|---|---|
| Standard | 0.391075 | 0.474561 | 0.637884 | 0.721370 | 0.884693 | 0.968179 | 1.131502 |
| Camarilla | 0.733334 | 0.755958 | 0.778582 | 0.801206 | 0.823830 | 0.846454 | 0.869079 |
| Woodie | 0.430993 | 0.494520 | 0.677802 | 0.741329 | 0.924611 | 0.988138 | 1.171420 |
| Fibonacci | 0.474561 | 0.568842 | 0.627089 | 0.721370 | 0.815651 | 0.873898 | 0.968179 |
Numerical data
The following are the details of the technical indicators and moving averages that were collected to generate this technical analysis:
| RSI (14): | 43.22 | |
| MACD (12,26,9): | -0.0023 | |
| Directional Movement: | -4.010026 | |
| AROON (14): | 35.714286 | |
| DEMA (21): | 0.670159 | |
| Parabolic SAR (0,02-0,02-0,2): | 0.658069 | |
| Elder Ray (13): | -0.007599 | |
| Super Trend (3,10): | 0.655750 | |
| Zig ZAG (10): | 0.664227 | |
| VORTEX (21): | 0.9653 | |
| Stochastique (14,3,5): | 55.32 | |
| TEMA (21): | 0.671351 | |
| Williams %R (14): | -57.56 | |
| Chande Momentum Oscillator (20): | -0.005127 | |
| Repulse (5,40,3): | -1.1093 | |
| ROCnROLL: | 2 | |
| TRIX (15,9): | -0.0620 | |
| Courbe Coppock: | 2.46 |
| MA7: | 0.693856 | |
| MA20: | 0.755330 | |
| MA50: | 0.744014 | |
| MA100: | 0.625559 | |
| MAexp7: | 0.672965 | |
| MAexp20: | 0.673671 | |
| MAexp50: | 0.678519 | |
| MAexp100: | 0.683894 | |
| Price / MA7: | -3.59% | |
| Price / MA20: | -11.44% | |
| Price / MA50: | -10.09% | |
| Price / MA100: | +6.93% | |
| Price / MAexp7: | -0.60% | |
| Price / MAexp20: | -0.70% | |
| Price / MAexp50: | -1.41% | |
| Price / MAexp100: | -2.19% |
About author
Online


Add a comment
Comments
0 comments on the analysis BANCOR NETWORK TOKEN - BNT/USD - 1H