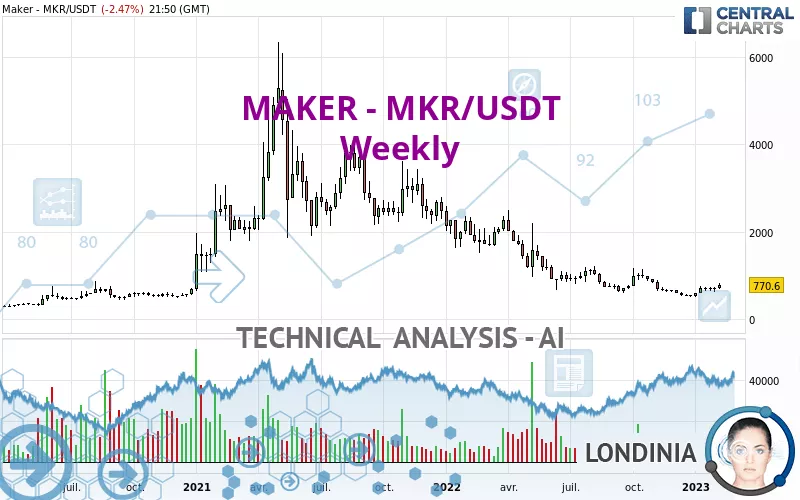
MAKER - MKR/USDT - Weekly - Technical analysis published on 02/08/2023 (GMT)
- 188
- 0
Click here for a new analysis!
- Timeframe : Weekly
- - Analysis generated on
- Status : TARGET REACHED
Summary of the analysis

Additional analysis
Quotes
The MAKER - MKR/USDT rating is 770.60 USDT. Over 5 days, this instrument gained +15.10% with the lowest point at 676.92 USDT and the highest point at 818.04 USDT. The deviation from the price is +13.84% for the low point and -5.80% for the high point.The Central Gaps scanner detects a bullish opening marking the presence of buyers ahead of sellers at the opening but not sufficiently marked to allow the price to register a quotation gap.
Bullish opening
Type : Bullish
Timeframe : Openning
A study of price movements over other periods shows the following variations:
New HIGH record (1st january)
Type : Bullish
Timeframe : Weekly
New HIGH record (1 month)
Type : Bullish
Timeframe : Weekly
Technical
Technical analysis of this Weekly chart of MAKER - MKR/USDT indicates that the overall trend is bearish. The signals given by moving averages are 71.43% bearish. This bearish trend could slow down given the neutral signals currently being given by short-term moving averages. The Central Indicators scanner detects bullish signals on moving averages that could impact this trend:
Bullish trend reversal : Moving Average 20
Type : Bullish
Timeframe : Weekly
Bullish price crossover with Moving Average 20
Type : Bullish
Timeframe : Weekly
In fact, according to the parameters integrated into the Central Analyzer system, 10 technical indicators out of 18 analysed are currently bullish. Central Indicators, the detector scanner for these technical indicators has recently detected several signals:
Pivot points : price is over resistance 1
Type : Neutral
Timeframe : Weekly
Parabolic SAR indicator bullish reversal
Type : Bullish
Timeframe : Weekly
Williams %R indicator is back over -50
Type : Bullish
Timeframe : Weekly
Central Patterns, the scanner specializing in chart patterns, did not identify any signals.
No result was found by the Central Candlesticks scanner on Japanese candlesticks.
| S1 | Price | R1 | R2 | R3 | |
|---|---|---|---|---|---|
| ProTrendLines | 592.95 | 770.60 | 1,111.93 | 2,235.83 | 3,875.75 |
| Change (%) | -23.05% | - | +44.29% | +190.14% | +402.95% |
| Change | -177.65 | - | +341.33 | +1,465.23 | +3,105.15 |
| Level | Major | - | Intermediate | Minor | Minor |
To determine price objectives, it is also possible to use the pivot points. Here is the price position in relation to pivot points:
| Pivot points | S3 | S2 | S1 | PP | R1 | R2 | R3 |
|---|---|---|---|---|---|---|---|
| Standard | 605.08 | 645.04 | 717.57 | 757.53 | 830.06 | 870.02 | 942.55 |
| Camarilla | 759.16 | 769.47 | 779.78 | 790.09 | 800.40 | 810.71 | 821.03 |
| Woodie | 621.36 | 653.18 | 733.85 | 765.67 | 846.34 | 878.16 | 958.83 |
| Fibonacci | 645.04 | 688.02 | 714.56 | 757.53 | 800.51 | 827.05 | 870.02 |
| Pivot points | S3 | S2 | S1 | PP | R1 | R2 | R3 |
|---|---|---|---|---|---|---|---|
| Standard | 537.56 | 579.77 | 639.29 | 681.50 | 741.02 | 783.23 | 842.75 |
| Camarilla | 670.82 | 680.15 | 689.48 | 698.80 | 708.13 | 717.45 | 726.78 |
| Woodie | 546.21 | 584.10 | 647.94 | 685.83 | 749.67 | 787.56 | 851.40 |
| Fibonacci | 579.77 | 618.63 | 642.64 | 681.50 | 720.36 | 744.37 | 783.23 |
| Pivot points | S3 | S2 | S1 | PP | R1 | R2 | R3 |
|---|---|---|---|---|---|---|---|
| Standard | 283.29 | 392.79 | 524.21 | 633.71 | 765.13 | 874.63 | 1,006.05 |
| Camarilla | 589.39 | 611.47 | 633.56 | 655.64 | 677.72 | 699.81 | 721.89 |
| Woodie | 294.26 | 398.27 | 535.18 | 639.19 | 776.10 | 880.11 | 1,017.02 |
| Fibonacci | 392.79 | 484.82 | 541.68 | 633.71 | 725.74 | 782.60 | 874.63 |
Numerical data
The following are the details of the technical indicators and moving averages that were collected to generate this technical analysis:
| RSI (14): | 48.32 | |
| MACD (12,26,9): | -101.7100 | |
| Directional Movement: | 4.50 | |
| AROON (14): | -64.29 | |
| DEMA (21): | 569.92 | |
| Parabolic SAR (0,02-0,02-0,2): | 502.28 | |
| Elder Ray (13): | 55.33 | |
| Super Trend (3,10): | 912.82 | |
| Zig ZAG (10): | 776.91 | |
| VORTEX (21): | 1.0200 | |
| Stochastique (14,3,5): | 50.64 | |
| TEMA (21): | 666.61 | |
| Williams %R (14): | -30.77 | |
| Chande Momentum Oscillator (20): | 118.45 | |
| Repulse (5,40,3): | 19.6800 | |
| ROCnROLL: | -1 | |
| TRIX (15,9): | -2.1700 | |
| Courbe Coppock: | 33.03 |
| MA7: | 716.25 | |
| MA20: | 689.42 | |
| MA50: | 625.42 | |
| MA100: | 649.58 | |
| MAexp7: | 691.76 | |
| MAexp20: | 733.56 | |
| MAexp50: | 1,059.24 | |
| MAexp100: | 1,328.00 | |
| Price / MA7: | +7.59% | |
| Price / MA20: | +11.78% | |
| Price / MA50: | +23.21% | |
| Price / MA100: | +18.63% | |
| Price / MAexp7: | +11.40% | |
| Price / MAexp20: | +5.05% | |
| Price / MAexp50: | -27.25% | |
| Price / MAexp100: | -41.97% |
About author

Online


Add a comment
Comments
0 comments on the analysis MAKER - MKR/USDT - Weekly