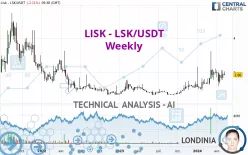
LISK - LSK/USDT - Weekly - Technical analysis published on 05/11/2024 (GMT)
- 130
- 0
Click here for a new analysis!
- Timeframe : Weekly
- - Analysis generated on
- Status : INVALID

Summary of the analysis

Additional analysis
Quotes
The LISK - LSK/USDT rating is 1.86 USDT. The price registered a decrease of -2.76% over 5 days and has been traded over the last 5 days between 1.82 USDT and 2.06 USDT. This implies that the 5 day price is +2.32% from its lowest point and -9.50% from its highest point.A bearish opening was detected by the Central Gaps scanner. Sellers are trying to impose a bearish trend in the very short term.
Bearish opening
Type : Bearish
Timeframe : Openning
A study of price movements over other periods shows the following variations:
Technical
Technical analysis of LISK - LSK/USDT in Weekly shows a strongly overall bullish trend. 92.86% of the signals given by moving averages are bullish. The overall trend is supported by the strong bullish signals from short-term moving averages. The Central Indicators scanner does not detect any result on moving averages that would impact this trend.
An assessment of technical indicators shows a slightly bullish signal.
But beware of excesses. The Central Indicators scanner currently detects this:
MACD indicator: bearish divergence
Type : Bullish
Timeframe : Weekly
MACD crosses DOWN its Moving Average
Type : Bearish
Timeframe : Weekly
Ichimoku - Bearish crossover : Tenkan & Kijun
Type : Bearish
Timeframe : Weekly
Price is back under the pivot point
Type : Bearish
Timeframe : Weekly
The Central Patterns scanner, which studies chart patterns, resistances and supports, has identified this signal:
Near support of triangle
Type : Bullish
Timeframe : Weekly
The Central Candlesticks scanner, specialised in Japanese candlesticks, did not identify any signals.
| S2 | S1 | Price | R1 | R2 | R3 | |
|---|---|---|---|---|---|---|
| ProTrendLines | 0.68 | 1.30 | 1.86 | 2.74 | 4.10 | 5.16 |
| Change (%) | -63.44% | -30.11% | - | +47.31% | +120.43% | +177.42% |
| Change | -1.18 | -0.56 | - | +0.88 | +2.24 | +3.30 |
| Level | Minor | Major | - | Major | Minor | Minor |
To determine price objectives, it is also possible to use the pivot points. Here is the price position in relation to pivot points:
| Pivot points | S3 | S2 | S1 | PP | R1 | R2 | R3 |
|---|---|---|---|---|---|---|---|
| Standard | 1.72 | 1.80 | 1.85 | 1.93 | 1.98 | 2.06 | 2.11 |
| Camarilla | 1.86 | 1.88 | 1.89 | 1.90 | 1.91 | 1.92 | 1.94 |
| Woodie | 1.71 | 1.79 | 1.84 | 1.92 | 1.97 | 2.05 | 2.10 |
| Fibonacci | 1.80 | 1.85 | 1.88 | 1.93 | 1.98 | 2.01 | 2.06 |
| Pivot points | S3 | S2 | S1 | PP | R1 | R2 | R3 |
|---|---|---|---|---|---|---|---|
| Standard | 1.06 | 1.30 | 1.63 | 1.87 | 2.20 | 2.44 | 2.77 |
| Camarilla | 1.80 | 1.86 | 1.91 | 1.96 | 2.01 | 2.07 | 2.12 |
| Woodie | 1.11 | 1.32 | 1.68 | 1.89 | 2.25 | 2.46 | 2.82 |
| Fibonacci | 1.30 | 1.52 | 1.65 | 1.87 | 2.09 | 2.22 | 2.44 |
| Pivot points | S3 | S2 | S1 | PP | R1 | R2 | R3 |
|---|---|---|---|---|---|---|---|
| Standard | 0.20 | 0.70 | 1.14 | 1.64 | 2.08 | 2.58 | 3.02 |
| Camarilla | 1.33 | 1.42 | 1.50 | 1.59 | 1.68 | 1.76 | 1.85 |
| Woodie | 0.18 | 0.69 | 1.12 | 1.63 | 2.06 | 2.57 | 3.00 |
| Fibonacci | 0.70 | 1.06 | 1.28 | 1.64 | 2.00 | 2.22 | 2.58 |
Numerical data
The following are the details of the technical indicators and moving averages that were collected to generate this technical analysis:
| RSI (14): | 58.19 | |
| MACD (12,26,9): | 0.2000 | |
| Directional Movement: | 17.26 | |
| AROON (14): | -35.72 | |
| DEMA (21): | 1.88 | |
| Parabolic SAR (0,02-0,02-0,2): | 1.27 | |
| Elder Ray (13): | 0.22 | |
| Super Trend (3,10): | 1.10 | |
| Zig ZAG (10): | 1.85 | |
| VORTEX (21): | 1.0700 | |
| Stochastique (14,3,5): | 33.27 | |
| TEMA (21): | 1.95 | |
| Williams %R (14): | -67.65 | |
| Chande Momentum Oscillator (20): | 0.50 | |
| Repulse (5,40,3): | -6.6900 | |
| ROCnROLL: | 1 | |
| TRIX (15,9): | 2.4600 | |
| Courbe Coppock: | 91.83 |
| MA7: | 1.92 | |
| MA20: | 1.81 | |
| MA50: | 1.82 | |
| MA100: | 1.73 | |
| MAexp7: | 1.80 | |
| MAexp20: | 1.62 | |
| MAexp50: | 1.36 | |
| MAexp100: | 1.33 | |
| Price / MA7: | -3.13% | |
| Price / MA20: | +2.76% | |
| Price / MA50: | +2.20% | |
| Price / MA100: | +7.51% | |
| Price / MAexp7: | +3.33% | |
| Price / MAexp20: | +14.81% | |
| Price / MAexp50: | +36.76% | |
| Price / MAexp100: | +39.85% |
About author

Online


Add a comment
Comments
0 comments on the analysis LISK - LSK/USDT - Weekly