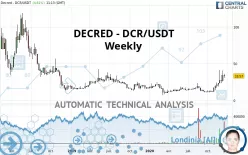
DECRED - DCR/USDT - Weekly - Technical analysis published on 12/24/2020 (GMT)
- 206
- 0
Click here for a new analysis!
- Timeframe : Weekly
- - Analysis generated on
- Status : TARGET REACHED

Summary of the analysis

Additional analysis
Quotes
The DECRED - DCR/USDT price is 33.57 USDT. Over 5 days, this instrument lost -7.29% with the lowest point at 31.11 USDT and the highest point at 36.29 USDT. The deviation from the price is +7.91% for the low point and -7.50% for the high point.The Central Gaps scanner detects a bearish opening marking the presence of sellers ahead of buyers at the opening but not sufficiently marked to allow the price to register a quotation gap.
Bearish opening
Type : Bearish
Timeframe : Openning
A study of price movements over other periods shows the following variations:
Abnormal volumes
Timeframe : 5 days
Abnormal volumes
Timeframe : 20 days
Abnormal volumes
Timeframe : 50 days
Technical
Technical analysis of this Weekly chart of DECRED - DCR/USDT indicates that the overall trend is bullish. 78.57% of the signals given by moving averages are bullish. The overall trend is reinforced by the strong bullish signals from short-term moving averages. The Central Indicators scanner does not detect any result on moving averages that would impact this trend.
In fact, according to the parameters integrated into the Central Analyzer system, 15 technical indicators out of 18 analysed are currently bullish. But beware of excesses. The Central Indicators scanner currently detects this:
RSI indicator is overbought : over 70
Type : Neutral
Timeframe : Weekly
CCI indicator is overbought : over 100
Type : Neutral
Timeframe : Weekly
Williams %R indicator is overbought : over -20
Type : Neutral
Timeframe : Weekly
Price is back over the pivot point
Type : Bullish
Timeframe : Weekly
Central Patterns, the market scanner focusing on chart patterns, resistances and supports found this result:
Horizontal support is broken
Type : Bearish
Timeframe : Weekly
For a small rebound in the very short term, the Central Candlesticks scanner currently notes the presence of these bullish patterns in Japanese candlesticks:
Bullish engulfing lines
Type : Bullish
Timeframe : Weekly
Long white line
Type : Bullish
Timeframe : Weekly
| S1 | Price | R1 | R2 | R3 | |
|---|---|---|---|---|---|
| ProTrendLines | 13.93 | 33.57 | 35.25 | 52.71 | 76.91 |
| Change (%) | -58.50% | - | +5.00% | +57.02% | +129.10% |
| Change | -19.64 | - | +1.68 | +19.14 | +43.34 |
| Level | Intermediate | - | Major | Minor | Minor |
Pivot points can also be used to set your price objectives. Here is the price situation in relation to pivot points:
| Pivot points | S3 | S2 | S1 | PP | R1 | R2 | R3 |
|---|---|---|---|---|---|---|---|
| Standard | 26.52 | 28.76 | 30.42 | 32.66 | 34.32 | 36.56 | 38.22 |
| Camarilla | 31.02 | 31.38 | 31.73 | 32.09 | 32.45 | 32.81 | 33.16 |
| Woodie | 26.24 | 28.62 | 30.14 | 32.52 | 34.04 | 36.42 | 37.94 |
| Fibonacci | 28.76 | 30.25 | 31.17 | 32.66 | 34.15 | 35.07 | 36.56 |
| Pivot points | S3 | S2 | S1 | PP | R1 | R2 | R3 |
|---|---|---|---|---|---|---|---|
| Standard | 10.79 | 18.27 | 26.15 | 33.63 | 41.51 | 48.99 | 56.87 |
| Camarilla | 29.82 | 31.22 | 32.63 | 34.04 | 35.45 | 36.86 | 38.26 |
| Woodie | 11.00 | 18.37 | 26.36 | 33.73 | 41.72 | 49.09 | 57.08 |
| Fibonacci | 18.27 | 24.13 | 27.76 | 33.63 | 39.49 | 43.12 | 48.99 |
| Pivot points | S3 | S2 | S1 | PP | R1 | R2 | R3 |
|---|---|---|---|---|---|---|---|
| Standard | 2.50 | 7.06 | 15.82 | 20.38 | 29.14 | 33.70 | 42.46 |
| Camarilla | 20.91 | 22.13 | 23.35 | 24.57 | 25.79 | 27.01 | 28.23 |
| Woodie | 4.59 | 8.11 | 17.91 | 21.43 | 31.23 | 34.75 | 44.55 |
| Fibonacci | 7.06 | 12.15 | 15.30 | 20.38 | 25.47 | 28.62 | 33.70 |
Numerical data
The following are the details of the technical indicators and moving averages that were collected to generate this technical analysis:
| RSI (14): | 73.56 | |
| MACD (12,26,9): | 3.8900 | |
| Directional Movement: | 35.71 | |
| AROON (14): | 71.43 | |
| DEMA (21): | 25.06 | |
| Parabolic SAR (0,02-0,02-0,2): | 17.11 | |
| Elder Ray (13): | 10.29 | |
| Super Trend (3,10): | 15.44 | |
| Zig ZAG (10): | 33.70 | |
| VORTEX (21): | 1.1500 | |
| Stochastique (14,3,5): | 67.36 | |
| TEMA (21): | 28.90 | |
| Williams %R (14): | -25.91 | |
| Chande Momentum Oscillator (20): | 22.01 | |
| Repulse (5,40,3): | 10.2200 | |
| ROCnROLL: | 1 | |
| TRIX (15,9): | 1.4200 | |
| Courbe Coppock: | 182.50 |
| MA7: | 34.04 | |
| MA20: | 29.80 | |
| MA50: | 24.24 | |
| MA100: | 18.18 | |
| MAexp7: | 27.28 | |
| MAexp20: | 21.02 | |
| MAexp50: | 18.99 | |
| MAexp100: | 21.74 | |
| Price / MA7: | -1.38% | |
| Price / MA20: | +12.65% | |
| Price / MA50: | +38.49% | |
| Price / MA100: | +84.65% | |
| Price / MAexp7: | +23.06% | |
| Price / MAexp20: | +59.71% | |
| Price / MAexp50: | +76.78% | |
| Price / MAexp100: | +54.42% |
About author

Online


Add a comment
Comments
0 comments on the analysis DECRED - DCR/USDT - Weekly