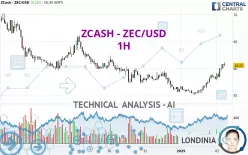
ZCASH - ZEC/USD - 1H - Technical analysis published on 01/02/2025 (GMT)
- 135
- 0
Click here for a new analysis!
- Timeframe : 1H
- - Analysis generated on
- Status : LEVEL MAINTAINED

Summary of the analysis

Additional analysis
Quotes
The ZCASH - ZEC/USD rating is 60.55 USD. The price registered an increase of +4.24% on the session and was between 57.84 USD and 61.21 USD. This implies that the price is at +4.69% from its lowest and at -1.08% from its highest.A study of price movements over other periods shows the following variations:
New HIGH record (1st january)
Type : Bullish
Timeframe : Weekly
Abnormal volumes on ZCASH - ZEC/USD were detected by the Central Volumes scanner:
Abnormal volumes
Timeframe : 20 days
Abnormal volumes
Timeframe : 50 days
Technical
Technical analysis of this 1H chart of ZCASH - ZEC/USD indicates that the overall trend is bullish. The signals returned by the moving averages are 67.86% bullish. This bullish trend is reinforced by the strong signals currently being given by short-term moving averages. There is no crossing of moving average by the price or crossing of moving averages between themselves.
In fact, 16 technical indicators on 18 studied are currently positioned bullish. Caution: the Central Indicators scanner currently detects an excess:
RSI indicator is overbought : over 70
Type : Neutral
Timeframe : 1 hour
CCI indicator is overbought : over 100
Type : Neutral
Timeframe : 1 hour
Williams %R indicator is overbought : over -20
Type : Neutral
Timeframe : 1 hour
Pivot points : price is over resistance 1
Type : Neutral
Timeframe : 1 hour
The analysis of the price chart with Central Patterns scanners does not return any result.
From the Japanese candlestick perspective, the Central Candlesticks scanner notes the presence of these results that could impact the short-term trend:
Upside gap
Type : Bullish
Timeframe : 1 hour
Bearish doji star
Type : Bearish
Timeframe : 1 hour
| S3 | S2 | S1 | Price | R1 | R2 | R3 | |
|---|---|---|---|---|---|---|---|
| ProTrendLines | 55.02 | 57.11 | 58.88 | 60.55 | 66.20 | 70.28 | 74.69 |
| Change (%) | -9.13% | -5.68% | -2.76% | - | +9.33% | +16.07% | +23.35% |
| Change | -5.53 | -3.44 | -1.67 | - | +5.65 | +9.73 | +14.14 |
| Level | Intermediate | Minor | Intermediate | - | Major | Minor | Major |
To determine price objectives, it is also possible to use the pivot points. Here is the price position in relation to pivot points:
| Pivot points | S3 | S2 | S1 | PP | R1 | R2 | R3 |
|---|---|---|---|---|---|---|---|
| Standard | 51.80 | 53.41 | 55.75 | 57.36 | 59.70 | 61.31 | 63.65 |
| Camarilla | 57.00 | 57.37 | 57.73 | 58.09 | 58.45 | 58.81 | 59.18 |
| Woodie | 52.17 | 53.59 | 56.12 | 57.54 | 60.07 | 61.49 | 64.02 |
| Fibonacci | 53.41 | 54.92 | 55.85 | 57.36 | 58.87 | 59.80 | 61.31 |
| Pivot points | S3 | S2 | S1 | PP | R1 | R2 | R3 |
|---|---|---|---|---|---|---|---|
| Standard | 21.24 | 35.88 | 49.23 | 63.87 | 77.22 | 91.86 | 105.21 |
| Camarilla | 54.87 | 57.44 | 60.00 | 62.57 | 65.14 | 67.70 | 70.27 |
| Woodie | 20.59 | 35.56 | 48.58 | 63.55 | 76.57 | 91.54 | 104.56 |
| Fibonacci | 35.88 | 46.58 | 53.18 | 63.87 | 74.57 | 81.17 | 91.86 |
| Pivot points | S3 | S2 | S1 | PP | R1 | R2 | R3 |
|---|---|---|---|---|---|---|---|
| Standard | 0.40 | 20.81 | 38.49 | 58.90 | 76.58 | 96.99 | 114.67 |
| Camarilla | 45.71 | 49.20 | 52.69 | 56.18 | 59.67 | 63.16 | 66.66 |
| Woodie | -0.96 | 20.13 | 37.14 | 58.22 | 75.23 | 96.31 | 113.32 |
| Fibonacci | 20.81 | 35.36 | 44.35 | 58.90 | 73.45 | 82.44 | 96.99 |
Numerical data
The following is the status of technical indicators and moving averages registered at the time this technical analysis was created:
| RSI (14): | 76.10 | |
| MACD (12,26,9): | 0.9700 | |
| Directional Movement: | 25.87 | |
| AROON (14): | 100.00 | |
| DEMA (21): | 59.50 | |
| Parabolic SAR (0,02-0,02-0,2): | 58.11 | |
| Elder Ray (13): | 1.84 | |
| Super Trend (3,10): | 58.49 | |
| Zig ZAG (10): | 60.87 | |
| VORTEX (21): | 1.3500 | |
| Stochastique (14,3,5): | 94.91 | |
| TEMA (21): | 60.56 | |
| Williams %R (14): | -0.61 | |
| Chande Momentum Oscillator (20): | 3.88 | |
| Repulse (5,40,3): | 2.8000 | |
| ROCnROLL: | 1 | |
| TRIX (15,9): | 0.1500 | |
| Courbe Coppock: | 12.29 |
| MA7: | 59.77 | |
| MA20: | 59.49 | |
| MA50: | 57.34 | |
| MA100: | 46.37 | |
| MAexp7: | 59.82 | |
| MAexp20: | 58.44 | |
| MAexp50: | 58.00 | |
| MAexp100: | 59.00 | |
| Price / MA7: | +1.31% | |
| Price / MA20: | +1.78% | |
| Price / MA50: | +5.60% | |
| Price / MA100: | +30.58% | |
| Price / MAexp7: | +1.22% | |
| Price / MAexp20: | +3.61% | |
| Price / MAexp50: | +4.40% | |
| Price / MAexp100: | +2.63% |
About author
Online


Add a comment
Comments
0 comments on the analysis ZCASH - ZEC/USD - 1H