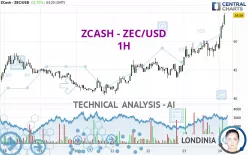
ZCASH - ZEC/USD - 1H - Technical analysis published on 11/24/2024 (GMT)
- 99
- 0
Click here for a new analysis!
- Timeframe : 1H
- - Analysis generated on
- Status : INVALID

Summary of the analysis

Additional analysis
Quotes
ZCASH - ZEC/USD rating 54.59 USD. The price registered an increase of +11.71% on the session and was traded between 48.56 USD and 54.95 USD over the period. The price is currently at +12.42% from its lowest and -0.66% from its highest.A bearish opening was detected by the Central Gaps scanner. Sellers are trying to impose a bearish trend in the very short term.
Bearish opening
Type : Bearish
Timeframe : Openning
Here is a more detailed summary of the historical variations registered by ZCASH - ZEC/USD:
New HIGH record (1 year)
Type : Bullish
Timeframe : Weekly
Near a new HIGH record (1 year)
Type : Bullish
Timeframe : Weekly
New HIGH record (1st january)
Type : Bullish
Timeframe : Weekly
New HIGH record (1 month)
Type : Bullish
Timeframe : Weekly
Near a new HIGH record (1 month)
Type : Bullish
Timeframe : Weekly
Technical
A technical analysis in 1H of this ZCASH - ZEC/USD chart shows a strongly bullish trend. 92.86% of the signals given by moving averages are bullish. The overall trend is supported by the strong bullish signals from short-term moving averages. The Central Indicators market scanner is currently detecting several bearish and bullish signals that could impact this trend:
Bullish trend reversal : Moving Average 100
Type : Bullish
Timeframe : 1 hour
Bullish trend reversal : adaptative moving average 20
Type : Bullish
Timeframe : 1 hour
Bullish trend reversal : adaptative moving average 50
Type : Bullish
Timeframe : 1 hour
Bearish price crossover with Moving Average 20
Type : Bearish
Timeframe : 1 hour
In fact, 15 technical indicators on 18 studied are currently positioned bullish. Caution: the Central Indicators scanner currently detects an excess:
RSI indicator is overbought : over 70
Type : Neutral
Timeframe : 1 hour
CCI indicator is overbought : over 100
Type : Neutral
Timeframe : 1 hour
Previous candle closed over Bollinger bands
Type : Neutral
Timeframe : 1 hour
Williams %R indicator is overbought : over -20
Type : Neutral
Timeframe : 1 hour
Pivot points : price is over resistance 1
Type : Neutral
Timeframe : Weekly
Pivot points : price is over resistance 2
Type : Neutral
Timeframe : 1 hour
Price is back under the pivot point
Type : Bearish
Timeframe : 1 hour
No signals are given by Central Patterns, a market scanner specialised in chart patterns, resistances and supports.
For a small setback in the very short term, the Central Candlesticks scanner currently notes the presence of this bearish pattern in Japanese candlesticks:
Bearish harami
Type : Bearish
Timeframe : 1 hour
| S3 | S2 | S1 | Price | R1 | R2 | |
|---|---|---|---|---|---|---|
| ProTrendLines | 47.00 | 47.95 | 50.88 | 54.59 | 80.08 | 210.57 |
| Change (%) | -13.90% | -12.16% | -6.80% | - | +46.69% | +285.73% |
| Change | -7.59 | -6.64 | -3.71 | - | +25.49 | +155.98 |
| Level | Major | Intermediate | Major | - | Minor | Minor |
To determine price objectives, it is also possible to use the pivot points. Here is the price position in relation to pivot points:
| Pivot points | S3 | S2 | S1 | PP | R1 | R2 | R3 |
|---|---|---|---|---|---|---|---|
| Standard | 42.01 | 43.90 | 46.38 | 48.27 | 50.75 | 52.64 | 55.12 |
| Camarilla | 47.67 | 48.07 | 48.47 | 48.87 | 49.27 | 49.67 | 50.07 |
| Woodie | 42.32 | 44.05 | 46.69 | 48.42 | 51.06 | 52.79 | 55.43 |
| Fibonacci | 43.90 | 45.57 | 46.60 | 48.27 | 49.94 | 50.97 | 52.64 |
| Pivot points | S3 | S2 | S1 | PP | R1 | R2 | R3 |
|---|---|---|---|---|---|---|---|
| Standard | 33.26 | 36.90 | 42.88 | 46.52 | 52.50 | 56.14 | 62.12 |
| Camarilla | 46.23 | 47.11 | 47.99 | 48.87 | 49.75 | 50.63 | 51.52 |
| Woodie | 34.44 | 37.49 | 44.06 | 47.11 | 53.68 | 56.73 | 63.30 |
| Fibonacci | 36.90 | 40.57 | 42.84 | 46.52 | 50.19 | 52.46 | 56.14 |
| Pivot points | S3 | S2 | S1 | PP | R1 | R2 | R3 |
|---|---|---|---|---|---|---|---|
| Standard | 15.34 | 21.34 | 29.07 | 35.07 | 42.80 | 48.80 | 56.53 |
| Camarilla | 33.02 | 34.28 | 35.54 | 36.80 | 38.06 | 39.32 | 40.58 |
| Woodie | 16.21 | 21.77 | 29.94 | 35.50 | 43.67 | 49.23 | 57.40 |
| Fibonacci | 21.34 | 26.59 | 29.83 | 35.07 | 40.32 | 43.56 | 48.80 |
Numerical data
The following is the status of the technical indicators and moving averages at the time of publication of this technical analysis:
| RSI (14): | 74.96 | |
| MACD (12,26,9): | 1.2600 | |
| Directional Movement: | 27.81 | |
| AROON (14): | 50.00 | |
| DEMA (21): | 51.32 | |
| Parabolic SAR (0,02-0,02-0,2): | 48.31 | |
| Elder Ray (13): | 2.50 | |
| Super Trend (3,10): | 49.63 | |
| Zig ZAG (10): | 53.07 | |
| VORTEX (21): | 1.2200 | |
| Stochastique (14,3,5): | 96.37 | |
| TEMA (21): | 51.83 | |
| Williams %R (14): | -2.51 | |
| Chande Momentum Oscillator (20): | 4.62 | |
| Repulse (5,40,3): | 4.9100 | |
| ROCnROLL: | 1 | |
| TRIX (15,9): | 0.2800 | |
| Courbe Coppock: | 9.01 |
| MA7: | 46.18 | |
| MA20: | 43.80 | |
| MA50: | 38.99 | |
| MA100: | 35.50 | |
| MAexp7: | 51.62 | |
| MAexp20: | 49.44 | |
| MAexp50: | 47.75 | |
| MAexp100: | 46.18 | |
| Price / MA7: | +18.21% | |
| Price / MA20: | +24.63% | |
| Price / MA50: | +40.01% | |
| Price / MA100: | +53.77% | |
| Price / MAexp7: | +5.75% | |
| Price / MAexp20: | +10.42% | |
| Price / MAexp50: | +14.32% | |
| Price / MAexp100: | +18.21% |
About author
Online


Add a comment
Comments
0 comments on the analysis ZCASH - ZEC/USD - 1H