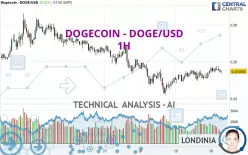
DOGECOIN - DOGE/USD - 1H - Technical analysis published on 02/20/2025 (GMT)
- 515
- 0
- Timeframe : 1H
- - Analysis generated on
- Status : NEUTRAL

Summary of the analysis

Additional analysis
Quotes
The DOGECOIN - DOGE/USD price is 0.254883 USD. On the day, this instrument gained +0.01% with the lowest point at 0.253689 USD and the highest point at 0.257702 USD. The deviation from the price is +0.47% for the low point and -1.09% for the high point.The Central Gaps scanner detects a bearish opening. A small advantage for sellers in the very short term.
Bearish opening
Type : Bearish
Timeframe : Openning
So that you have an overall view of the price change, here is a table showing the variations over several periods:
Technical
Technical analysis of this 1H chart of DOGECOIN - DOGE/USD indicates that the overall trend is slightly bearish. 57.14% of the signals given by moving averages are bearish. Caution: the slightly bullish signals currently given by short-term moving averages could cause a reversal of the trend. The Central Indicators scanner detects bearish signals on moving averages that could impact this trend:
Bearish price crossover with Moving Average 20
Type : Bearish
Timeframe : 1 hour
Bearish price crossover with adaptative moving average 20
Type : Bearish
Timeframe : 1 hour
On the 18 technical indicators analysed, 7 are bullish, 7 are neutral and 4 are bearish. Other results related to technical indicators were also found by the Central Indicators scanner:
Price is back under the pivot point
Type : Bearish
Timeframe : Weekly
Williams %R indicator is back under -50
Type : Bearish
Timeframe : 1 hour
An analysis of the price chart with the Central Patterns scanner (detector of chart patterns and resistances and supports) shows a result that can have an impact on the price change:
Near horizontal resistance
Type : Bearish
Timeframe : 1 hour
No result was found by the Central Candlesticks scanner on Japanese candlesticks.
| S3 | S2 | S1 | Price | R1 | R2 | R3 | |
|---|---|---|---|---|---|---|---|
| ProTrendLines | 0.220029 | 0.241861 | 0.249487 | 0.254883 | 0.255537 | 0.267764 | 0.273485 |
| Change (%) | -13.67% | -5.11% | -2.12% | - | +0.26% | +5.05% | +7.30% |
| Change | -0.034854 | -0.013022 | -0.005396 | - | +0.000654 | +0.012881 | +0.018602 |
| Level | Major | Minor | Intermediate | - | Intermediate | Major | Minor |
Attention could also be paid to pivot points to set price objectives:
| Pivot points | S3 | S2 | S1 | PP | R1 | R2 | R3 |
|---|---|---|---|---|---|---|---|
| Standard | 0.243140 | 0.245750 | 0.250303 | 0.252913 | 0.257466 | 0.260076 | 0.264629 |
| Camarilla | 0.252885 | 0.253542 | 0.254198 | 0.254855 | 0.255512 | 0.256168 | 0.256825 |
| Woodie | 0.244111 | 0.246236 | 0.251274 | 0.253399 | 0.258437 | 0.260562 | 0.265600 |
| Fibonacci | 0.245750 | 0.248487 | 0.250177 | 0.252913 | 0.255650 | 0.257340 | 0.260076 |
| Pivot points | S3 | S2 | S1 | PP | R1 | R2 | R3 |
|---|---|---|---|---|---|---|---|
| Standard | 0.198695 | 0.219248 | 0.245282 | 0.265835 | 0.291869 | 0.312422 | 0.338456 |
| Camarilla | 0.258504 | 0.262774 | 0.267045 | 0.271315 | 0.275586 | 0.279856 | 0.284126 |
| Woodie | 0.201435 | 0.220618 | 0.248022 | 0.267205 | 0.294609 | 0.313792 | 0.341196 |
| Fibonacci | 0.219248 | 0.237045 | 0.248039 | 0.265835 | 0.283632 | 0.294626 | 0.312422 |
| Pivot points | S3 | S2 | S1 | PP | R1 | R2 | R3 |
|---|---|---|---|---|---|---|---|
| Standard | 0.148309 | 0.226831 | 0.277843 | 0.356365 | 0.407377 | 0.485899 | 0.536911 |
| Camarilla | 0.293234 | 0.305108 | 0.316982 | 0.328856 | 0.340730 | 0.352604 | 0.364478 |
| Woodie | 0.134555 | 0.219954 | 0.264089 | 0.349488 | 0.393623 | 0.479022 | 0.523157 |
| Fibonacci | 0.226831 | 0.276313 | 0.306883 | 0.356365 | 0.405847 | 0.436417 | 0.485899 |
Numerical data
The following is the status of technical indicators and moving averages registered at the time this technical analysis was created:
| RSI (14): | 50.08 | |
| MACD (12,26,9): | 0.0007 | |
| Directional Movement: | 1.847663 | |
| AROON (14): | 64.285715 | |
| DEMA (21): | 0.254967 | |
| Parabolic SAR (0,02-0,02-0,2): | 0.253209 | |
| Elder Ray (13): | -0.000243 | |
| Super Trend (3,10): | 0.256904 | |
| Zig ZAG (10): | 0.253893 | |
| VORTEX (21): | 1.0141 | |
| Stochastique (14,3,5): | 60.80 | |
| TEMA (21): | 0.255736 | |
| Williams %R (14): | -51.34 | |
| Chande Momentum Oscillator (20): | 0.001935 | |
| Repulse (5,40,3): | -0.8824 | |
| ROCnROLL: | 2 | |
| TRIX (15,9): | 0.0441 | |
| Courbe Coppock: | 1.88 |
| MA7: | 0.261045 | |
| MA20: | 0.261978 | |
| MA50: | 0.317759 | |
| MA100: | 0.349566 | |
| MAexp7: | 0.254878 | |
| MAexp20: | 0.254100 | |
| MAexp50: | 0.254254 | |
| MAexp100: | 0.256763 | |
| Price / MA7: | -2.36% | |
| Price / MA20: | -2.71% | |
| Price / MA50: | -19.79% | |
| Price / MA100: | -27.09% | |
| Price / MAexp7: | +0.00% | |
| Price / MAexp20: | +0.31% | |
| Price / MAexp50: | +0.25% | |
| Price / MAexp100: | -0.73% |
About author
Online


Add a comment
Comments
0 comments on the analysis DOGECOIN - DOGE/USD - 1H