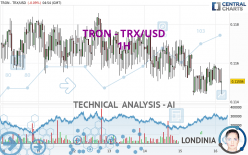
TRON - TRX/USD - 1H - Technical analysis published on 06/16/2024 (GMT)
- 122
- 0
Click here for a new analysis!
- Timeframe : 1H
- - Analysis generated on
- Status : INVALID

Summary of the analysis

Additional analysis
Quotes
The TRON - TRX/USD price is 0.115060 USD. On the day, this instrument lost -0.10% and was between 0.114392 USD and 0.115874 USD. This implies that the price is at +0.58% from its lowest and at -0.70% from its highest.The Central Gaps scanner detects a bullish opening. A small advantage for buyers in the very short term.
Bullish opening
Type : Bullish
Timeframe : Openning
A study of price movements over other periods shows the following variations:
Near a new LOW record (1 month)
Type : Bearish
Timeframe : Weekly
Technical
Technical analysis of this 1H chart of TRON - TRX/USD indicates that the overall trend is strongly bearish. 92.86% of the signals given by moving averages are bearish. The overall trend is supported by the strong bearish signals from short-term moving averages. An assessment of moving averages reveals several bearish and bullish signals:
Bearish trend reversal : adaptative moving average 20
Type : Bearish
Timeframe : 1 hour
Bullish price crossover with Moving Average 20
Type : Bullish
Timeframe : 1 hour
Bullish price crossover with adaptative moving average 20
Type : Bullish
Timeframe : 1 hour
Bullish price crossover with adaptative moving average 50
Type : Bullish
Timeframe : 1 hour
Bullish price crossover with adaptative moving average 100
Type : Bullish
Timeframe : 1 hour
In fact, only 7 technical indicators out of 18 studied are currently bullish. But beware of excesses. The Central Indicators scanner currently detects this:
MACD indicator: bullish divergence
Type : Bullish
Timeframe : 1 hour
RSI indicator is back over 50
Type : Bullish
Timeframe : 1 hour
Momentum indicator is back over 0
Type : Bullish
Timeframe : 1 hour
Williams %R indicator is back over -50
Type : Bullish
Timeframe : 1 hour
An analysis of the price chart with the Central Patterns scanner (detector of chart patterns and resistances and supports) shows a result that can have an impact on the price change:
Support of channel is broken
Type : Bearish
Timeframe : 1 hour
The presence of a bullish Japanese candlestick pattern detected by Central Candlesticks that could cause a very short term rebound was also detected:
Bullish engulfing lines
Type : Bullish
Timeframe : 1 hour
| S3 | S2 | S1 | Price | R1 | R2 | R3 | |
|---|---|---|---|---|---|---|---|
| ProTrendLines | 0.110761 | 0.112231 | 0.113439 | 0.115060 | 0.115670 | 0.117165 | 0.118121 |
| Change (%) | -3.74% | -2.46% | -1.41% | - | +0.53% | +1.83% | +2.66% |
| Change | -0.004299 | -0.002829 | -0.001621 | - | +0.000610 | +0.002105 | +0.003061 |
| Level | Minor | Minor | Minor | - | Major | Minor | Intermediate |
Attention could also be paid to pivot points to set price objectives:
| Pivot points | S3 | S2 | S1 | PP | R1 | R2 | R3 |
|---|---|---|---|---|---|---|---|
| Standard | 0.111073 | 0.112706 | 0.113938 | 0.115571 | 0.116803 | 0.118436 | 0.119668 |
| Camarilla | 0.114381 | 0.114644 | 0.114906 | 0.115169 | 0.115432 | 0.115694 | 0.115957 |
| Woodie | 0.110872 | 0.112606 | 0.113737 | 0.115471 | 0.116602 | 0.118336 | 0.119467 |
| Fibonacci | 0.112706 | 0.113801 | 0.114477 | 0.115571 | 0.116666 | 0.117342 | 0.118436 |
| Pivot points | S3 | S2 | S1 | PP | R1 | R2 | R3 |
|---|---|---|---|---|---|---|---|
| Standard | 0.107722 | 0.110574 | 0.112872 | 0.115724 | 0.118022 | 0.120874 | 0.123172 |
| Camarilla | 0.113753 | 0.114225 | 0.114697 | 0.115169 | 0.115641 | 0.116113 | 0.116585 |
| Woodie | 0.107444 | 0.110436 | 0.112594 | 0.115586 | 0.117744 | 0.120736 | 0.122894 |
| Fibonacci | 0.110574 | 0.112542 | 0.113757 | 0.115724 | 0.117692 | 0.118907 | 0.120874 |
| Pivot points | S3 | S2 | S1 | PP | R1 | R2 | R3 |
|---|---|---|---|---|---|---|---|
| Standard | 0.086611 | 0.098177 | 0.105108 | 0.116674 | 0.123605 | 0.135171 | 0.142102 |
| Camarilla | 0.106952 | 0.108648 | 0.110343 | 0.112039 | 0.113735 | 0.115430 | 0.117126 |
| Woodie | 0.084294 | 0.097018 | 0.102791 | 0.115515 | 0.121288 | 0.134012 | 0.139785 |
| Fibonacci | 0.098177 | 0.105243 | 0.109608 | 0.116674 | 0.123740 | 0.128105 | 0.135171 |
Numerical data
The following is the status of the technical indicators and moving averages at the time of publication of this technical analysis:
| RSI (14): | 50.90 | |
| MACD (12,26,9): | -0.0001 | |
| Directional Movement: | -2.204237 | |
| AROON (14): | 14.285715 | |
| DEMA (21): | 0.115239 | |
| Parabolic SAR (0,02-0,02-0,2): | 0.114882 | |
| Elder Ray (13): | -0.000094 | |
| Super Trend (3,10): | 0.114292 | |
| Zig ZAG (10): | 0.115673 | |
| VORTEX (21): | 0.8994 | |
| Stochastique (14,3,5): | 64.01 | |
| TEMA (21): | 0.115470 | |
| Williams %R (14): | -22.23 | |
| Chande Momentum Oscillator (20): | 0.001120 | |
| Repulse (5,40,3): | 0.5603 | |
| ROCnROLL: | -1 | |
| TRIX (15,9): | -0.0192 | |
| Courbe Coppock: | 0.60 |
| MA7: | 0.116537 | |
| MA20: | 0.114731 | |
| MA50: | 0.118922 | |
| MA100: | 0.119277 | |
| MAexp7: | 0.115498 | |
| MAexp20: | 0.115442 | |
| MAexp50: | 0.115787 | |
| MAexp100: | 0.116059 | |
| Price / MA7: | -1.27% | |
| Price / MA20: | +0.29% | |
| Price / MA50: | -3.25% | |
| Price / MA100: | -3.54% | |
| Price / MAexp7: | -0.38% | |
| Price / MAexp20: | -0.33% | |
| Price / MAexp50: | -0.63% | |
| Price / MAexp100: | -0.86% |
About author
Online


Add a comment
Comments
0 comments on the analysis TRON - TRX/USD - 1H