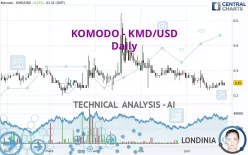
KOMODO - KMD/USD - Daily - Technical analysis published on 06/26/2023 (GMT)
- 139
- 0
Click here for a new analysis!
- Timeframe : Daily
- - Analysis generated on
- Status : INVALID

Summary of the analysis

Additional analysis
Quotes
The KOMODO - KMD/USD rating is 0.250000 USD. The price has increased by +4.17% since the last closing and was traded between 0.240000 USD and 0.250000 USD over the period. The price is currently at +4.17% from its lowest and 0% from its highest.A study of price movements over other periods shows the following variations:
Technical
Technical analysis of this Daily chart of KOMODO - KMD/USD indicates that the overall trend is bearish. 78.57% of the signals given by moving averages are bearish. Caution: the neutral signals currently given by short-term moving averages show us that the global trend is losing momentum. The Central Indicators market scanner is currently detecting several bearish and bullish signals that could impact this trend:
Bearish trend reversal : Moving Average 100
Type : Bearish
Timeframe : Daily
Bullish price crossover with Moving Average 20
Type : Bullish
Timeframe : Daily
In fact, according to the parameters integrated into the Central Analyzer system, 10 technical indicators out of 18 analysed are currently bullish. Central Indicators, the detector scanner for these technical indicators has recently detected several signals:
Price is back under the pivot point
Type : Bearish
Timeframe : Weekly
Momentum indicator is back over 0
Type : Bullish
Timeframe : Daily
Williams %R indicator is back over -50
Type : Bullish
Timeframe : Daily
The Central Patterns scanner, which studies chart patterns, resistances and supports, has identified this signal:
Near support of channel
Type : Bullish
Timeframe : Daily
No result was found by the Central Candlesticks scanner on Japanese candlesticks.
| S3 | S2 | S1 | Price | R1 | R2 | R3 | |
|---|---|---|---|---|---|---|---|
| ProTrendLines | 0.180000 | 0.200000 | 0.230000 | 0.250000 | 0.270000 | 0.320000 | 0.340000 |
| Change (%) | -28.00% | -20.00% | -8.00% | - | +8.00% | +28.00% | +36.00% |
| Change | -0.070000 | -0.050000 | -0.020000 | - | +0.020000 | +0.070000 | +0.090000 |
| Level | Intermediate | Minor | Intermediate | - | Major | Minor | Minor |
To determine price objectives, it is also possible to use the pivot points. Here is the price position in relation to pivot points:
| Pivot points | S3 | S2 | S1 | PP | R1 | R2 | R3 |
|---|---|---|---|---|---|---|---|
| Standard | 0.213333 | 0.226667 | 0.233333 | 0.246667 | 0.253333 | 0.266667 | 0.273333 |
| Camarilla | 0.234500 | 0.236333 | 0.238167 | 0.240000 | 0.241833 | 0.243667 | 0.245500 |
| Woodie | 0.210000 | 0.225000 | 0.230000 | 0.245000 | 0.250000 | 0.265000 | 0.270000 |
| Fibonacci | 0.226667 | 0.234307 | 0.239027 | 0.246667 | 0.254307 | 0.259027 | 0.266667 |
| Pivot points | S3 | S2 | S1 | PP | R1 | R2 | R3 |
|---|---|---|---|---|---|---|---|
| Standard | 0.203333 | 0.216667 | 0.233333 | 0.246667 | 0.263333 | 0.276667 | 0.293333 |
| Camarilla | 0.241750 | 0.244500 | 0.247250 | 0.250000 | 0.252750 | 0.255500 | 0.258250 |
| Woodie | 0.205000 | 0.217500 | 0.235000 | 0.247500 | 0.265000 | 0.277500 | 0.295000 |
| Fibonacci | 0.216667 | 0.228127 | 0.235207 | 0.246667 | 0.258127 | 0.265207 | 0.276667 |
| Pivot points | S3 | S2 | S1 | PP | R1 | R2 | R3 |
|---|---|---|---|---|---|---|---|
| Standard | 0.186667 | 0.223333 | 0.246667 | 0.283333 | 0.306667 | 0.343333 | 0.366667 |
| Camarilla | 0.253500 | 0.259000 | 0.264500 | 0.270000 | 0.275500 | 0.281000 | 0.286500 |
| Woodie | 0.180000 | 0.220000 | 0.240000 | 0.280000 | 0.300000 | 0.340000 | 0.360000 |
| Fibonacci | 0.223333 | 0.246253 | 0.260413 | 0.283333 | 0.306253 | 0.320413 | 0.343333 |
Numerical data
The following are the details of the technical indicators and moving averages that were collected to generate this technical analysis:
| RSI (14): | 41.55 | |
| MACD (12,26,9): | -0.0089 | |
| Directional Movement: | 3.026309 | |
| AROON (14): | -21.428571 | |
| DEMA (21): | 0.236126 | |
| Parabolic SAR (0,02-0,02-0,2): | 0.260000 | |
| Elder Ray (13): | 0.000286 | |
| Super Trend (3,10): | 0.297572 | |
| Zig ZAG (10): | 0.250000 | |
| VORTEX (21): | 1.0000 | |
| Stochastique (14,3,5): | 52.62 | |
| TEMA (21): | 0.238098 | |
| Williams %R (14): | -25.00 | |
| Chande Momentum Oscillator (20): | 0.020000 | |
| Repulse (5,40,3): | 0.8901 | |
| ROCnROLL: | -1 | |
| TRIX (15,9): | -0.6249 | |
| Courbe Coppock: | 8.95 |
| MA7: | 0.244286 | |
| MA20: | 0.245000 | |
| MA50: | 0.269200 | |
| MA100: | 0.284700 | |
| MAexp7: | 0.244331 | |
| MAexp20: | 0.247547 | |
| MAexp50: | 0.264701 | |
| MAexp100: | 0.271958 | |
| Price / MA7: | +2.34% | |
| Price / MA20: | +2.04% | |
| Price / MA50: | -7.13% | |
| Price / MA100: | -12.19% | |
| Price / MAexp7: | +2.32% | |
| Price / MAexp20: | +0.99% | |
| Price / MAexp50: | -5.55% | |
| Price / MAexp100: | -8.07% |
About author
Online


Add a comment
Comments
0 comments on the analysis KOMODO - KMD/USD - Daily