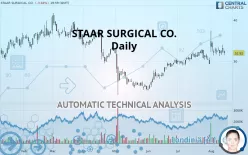
STAAR SURGICAL CO. - Daily - Technical analysis published on 08/15/2019 (GMT)
- 317
- 0
- Who voted?
Click here for a new analysis!
- Timeframe : Daily
- - Analysis generated on
- Status : TARGET REACHED

Summary of the analysis

Additional analysis
Quotes
The STAAR SURGICAL CO. price is 31.92 USD. The price is lower by -3.68% since the last closing with the lowest point at 31.41 USD and the highest point at 32.52 USD. The deviation from the price is +1.62% for the low point and -1.85% for the high point.The Central Gaps scanner detects a bullish opening marking the presence of sellers ahead of buyers at the opening but not sufficiently marked to allow the price to register a quotation gap.
Bearish opening
Type : Bearish
Timeframe : Openning
A study of price movements over other periods shows the following variations:
Technical
A technical analysis in Daily of this STAAR SURGICAL CO. chart shows a bullish trend. The signals given by moving averages are 71.43% bullish. This bullish trend is slowing down slightly given the slightly bullish signals of short-term moving averages. There is no crossing of moving average by the price or crossing of moving averages between themselves.
The technical indicators are generally neutral. They do not provide relevant information on the direction of future price movements.
Caution: the Central Indicators scanner currently detects an excess:
MACD indicator: bullish divergence
Type : Bullish
Timeframe : Daily
Pivot points : price is under support 1
Type : Neutral
Timeframe : Daily
Price is back over the pivot point
Type : Bullish
Timeframe : Daily
Price is back under the pivot point
Type : Bearish
Timeframe : Weekly
The Central Patterns scanner, which studies chart patterns, resistances and supports, has identified this signal:
Near horizontal resistance
Type : Bearish
Timeframe : Daily
The Central Candlesticks scanner, specialised in Japanese candlesticks, did not identify any signals.
| S3 | S2 | S1 | Price | R1 | R2 | R3 | |
|---|---|---|---|---|---|---|---|
| ProTrendLines | 19.35 | 23.08 | 27.81 | 31.92 | 32.65 | 37.06 | 40.78 |
| Change (%) | -39.38% | -27.69% | -12.88% | - | +2.29% | +16.10% | +27.76% |
| Change | -12.57 | -8.84 | -4.11 | - | +0.73 | +5.14 | +8.86 |
| Level | Major | Major | Intermediate | - | Major | Intermediate | Major |
To determine price objectives, it is also possible to use the pivot points. Here is the price position in relation to pivot points:
| Pivot points | S3 | S2 | S1 | PP | R1 | R2 | R3 |
|---|---|---|---|---|---|---|---|
| Standard | 30.05 | 30.99 | 32.07 | 33.01 | 34.09 | 35.03 | 36.11 |
| Camarilla | 32.59 | 32.77 | 32.96 | 33.14 | 33.33 | 33.51 | 33.70 |
| Woodie | 30.11 | 31.03 | 32.13 | 33.05 | 34.15 | 35.06 | 36.17 |
| Fibonacci | 30.99 | 31.77 | 32.24 | 33.01 | 33.79 | 34.26 | 35.03 |
| Pivot points | S3 | S2 | S1 | PP | R1 | R2 | R3 |
|---|---|---|---|---|---|---|---|
| Standard | 28.89 | 30.03 | 30.99 | 32.13 | 33.09 | 34.23 | 35.19 |
| Camarilla | 31.37 | 31.57 | 31.76 | 31.95 | 32.14 | 32.34 | 32.53 |
| Woodie | 28.80 | 29.99 | 30.90 | 32.09 | 33.00 | 34.19 | 35.10 |
| Fibonacci | 30.03 | 30.83 | 31.33 | 32.13 | 32.93 | 33.43 | 34.23 |
| Pivot points | S3 | S2 | S1 | PP | R1 | R2 | R3 |
|---|---|---|---|---|---|---|---|
| Standard | 23.80 | 26.36 | 27.83 | 30.39 | 31.86 | 34.42 | 35.89 |
| Camarilla | 28.20 | 28.57 | 28.94 | 29.31 | 29.68 | 30.05 | 30.42 |
| Woodie | 23.27 | 26.09 | 27.30 | 30.12 | 31.33 | 34.15 | 35.36 |
| Fibonacci | 26.36 | 27.90 | 28.85 | 30.39 | 31.93 | 32.88 | 34.42 |
Numerical data
The following are the details of the technical indicators and moving averages that were collected to generate this technical analysis:
| RSI (14): | 51.74 | |
| MACD (12,26,9): | 0.6700 | |
| Directional Movement: | 11.30 | |
| AROON (14): | 7.14 | |
| DEMA (21): | 32.85 | |
| Parabolic SAR (0,02-0,02-0,2): | 30.42 | |
| Elder Ray (13): | -0.25 | |
| Super Trend (3,10): | 29.18 | |
| Zig ZAG (10): | 31.92 | |
| VORTEX (21): | 0.8800 | |
| Stochastique (14,3,5): | 40.69 | |
| TEMA (21): | 32.79 | |
| Williams %R (14): | -66.69 | |
| Chande Momentum Oscillator (20): | 1.06 | |
| Repulse (5,40,3): | 1.5100 | |
| ROCnROLL: | -1 | |
| TRIX (15,9): | 0.3800 | |
| Courbe Coppock: | 7.04 |
| MA7: | 32.50 | |
| MA20: | 31.98 | |
| MA50: | 30.06 | |
| MA100: | 30.03 | |
| MAexp7: | 32.39 | |
| MAexp20: | 31.88 | |
| MAexp50: | 30.77 | |
| MAexp100: | 31.03 | |
| Price / MA7: | -1.78% | |
| Price / MA20: | -0.19% | |
| Price / MA50: | +6.19% | |
| Price / MA100: | +6.29% | |
| Price / MAexp7: | -1.45% | |
| Price / MAexp20: | +0.13% | |
| Price / MAexp50: | +3.74% | |
| Price / MAexp100: | +2.87% |
News
The latest news and videos published on STAAR SURGICAL CO. at the time of the analysis were as follows:
- SHAREHOLDER ALERT: Pomerantz Law Firm Investigates Claims On Behalf of Investors of STAAR Surgical Company - STAA
- SHAREHOLDER ALERT: Pomerantz Law Firm Investigates Claims On Behalf of Investors of STAAR Surgical Company - STAA
- STAAR Surgical Reports Fourth Quarter and Full Year 2018 Results
- STAAR Surgical Announces Strategic Cooperation Agreement With the Smile Eyes Group in Germany and Austria
- STAAR Surgical to Report Fourth Quarter Results on February 21, 2019
About author

Online


Add a comment
Comments
0 comments on the analysis STAAR SURGICAL CO. - Daily