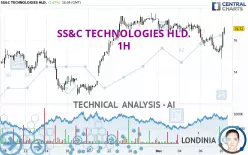
SS&C TECHNOLOGIES HLD. - 1H - Technical analysis published on 12/10/2024 (GMT)
- 124
- 0
Click here for a new analysis!
- Timeframe : 1H
- - Analysis generated on
- Status : LEVEL MAINTAINED

Summary of the analysis

Additional analysis
Quotes
SS&C TECHNOLOGIES HLD. rating 76.72 USD. On the day, this instrument gained +1.67% with the lowest point at 74.83 USD and the highest point at 76.84 USD. The deviation from the price is +2.53% for the low point and -0.16% for the high point.The Central Gaps scanner detects a bearish opening. A small advantage for sellers in the very short term.
Bearish opening
Type : Bearish
Timeframe : Openning
A study of price movements over other periods shows the following variations:
Near a new HIGH record (1 year)
Type : Bullish
Timeframe : Weekly
Near a new HIGH record (1st january)
Type : Bullish
Timeframe : Weekly
Near a new LOW record (1 month)
Type : Bearish
Timeframe : Weekly
Technical
A technical analysis in 1H of this SS&C TECHNOLOGIES HLD. chart shows a bullish trend. 75.00% of the signals given by moving averages are bullish. This bullish trend shows slight signs of slowing down given the slightly bullish signals given by the short-term moving averages. The Central Indicators market scanner is currently detecting several bullish signals that could impact this trend:
Bullish trend reversal : adaptative moving average 20
Type : Bullish
Timeframe : 1 hour
Bullish trend reversal : adaptative moving average 50
Type : Bullish
Timeframe : 1 hour
Bullish trend reversal : adaptative moving average 100
Type : Bullish
Timeframe : 1 hour
In fact, according to the parameters integrated into the Central Analyzer system, 13 technical indicators out of 18 analysed are currently bullish. But beware of excesses. The Central Indicators scanner currently detects this:
Williams %R indicator is overbought : over -20
Type : Neutral
Timeframe : 1 hour
Pivot points : price is over resistance 1
Type : Neutral
Timeframe : 1 hour
Central Patterns, the market scanner focusing on chart patterns, resistances and supports found these results:
Near support of channel
Type : Bullish
Timeframe : 1 hour
Near support of triangle
Type : Bullish
Timeframe : 1 hour
The presence of a bullish Japanese candlestick pattern detected by Central Candlesticks that could cause a very short term rebound was also detected:
Three white soldiers
Type : Bullish
Timeframe : 1 hour
| S3 | S2 | S1 | Price | R1 | R2 | |
|---|---|---|---|---|---|---|
| ProTrendLines | 73.13 | 75.23 | 76.42 | 76.72 | 77.09 | 80.66 |
| Change (%) | -4.68% | -1.94% | -0.39% | - | +0.48% | +5.14% |
| Change | -3.59 | -1.49 | -0.30 | - | +0.37 | +3.94 |
| Level | Major | Major | Major | - | Minor | Major |
Pivot points can also be used to set your price objectives. Here is the price situation in relation to pivot points:
| Pivot points | S3 | S2 | S1 | PP | R1 | R2 | R3 |
|---|---|---|---|---|---|---|---|
| Standard | 73.83 | 74.51 | 74.99 | 75.67 | 76.15 | 76.83 | 77.31 |
| Camarilla | 75.14 | 75.25 | 75.35 | 75.46 | 75.57 | 75.67 | 75.78 |
| Woodie | 73.72 | 74.46 | 74.88 | 75.62 | 76.04 | 76.78 | 77.20 |
| Fibonacci | 74.51 | 74.96 | 75.23 | 75.67 | 76.12 | 76.39 | 76.83 |
| Pivot points | S3 | S2 | S1 | PP | R1 | R2 | R3 |
|---|---|---|---|---|---|---|---|
| Standard | 73.64 | 74.63 | 75.37 | 76.36 | 77.10 | 78.09 | 78.83 |
| Camarilla | 75.64 | 75.80 | 75.96 | 76.12 | 76.28 | 76.44 | 76.60 |
| Woodie | 73.53 | 74.57 | 75.26 | 76.30 | 76.99 | 78.03 | 78.72 |
| Fibonacci | 74.63 | 75.29 | 75.70 | 76.36 | 77.02 | 77.43 | 78.09 |
| Pivot points | S3 | S2 | S1 | PP | R1 | R2 | R3 |
|---|---|---|---|---|---|---|---|
| Standard | 64.34 | 67.03 | 72.06 | 74.75 | 79.78 | 82.47 | 87.50 |
| Camarilla | 74.97 | 75.68 | 76.38 | 77.09 | 77.80 | 78.51 | 79.21 |
| Woodie | 65.51 | 67.62 | 73.23 | 75.34 | 80.95 | 83.06 | 88.67 |
| Fibonacci | 67.03 | 69.98 | 71.80 | 74.75 | 77.70 | 79.52 | 82.47 |
Numerical data
The following is the status of the technical indicators and moving averages at the time of publication of this technical analysis:
| RSI (14): | 58.68 | |
| MACD (12,26,9): | -0.1700 | |
| Directional Movement: | 3.42 | |
| AROON (14): | 14.29 | |
| DEMA (21): | 75.77 | |
| Parabolic SAR (0,02-0,02-0,2): | 74.83 | |
| Elder Ray (13): | 0.56 | |
| Super Trend (3,10): | 75.17 | |
| Zig ZAG (10): | 76.53 | |
| VORTEX (21): | 0.9700 | |
| Stochastique (14,3,5): | 80.80 | |
| TEMA (21): | 75.72 | |
| Williams %R (14): | -6.04 | |
| Chande Momentum Oscillator (20): | 0.46 | |
| Repulse (5,40,3): | 1.5600 | |
| ROCnROLL: | 1 | |
| TRIX (15,9): | -0.0500 | |
| Courbe Coppock: | 1.12 |
| MA7: | 76.45 | |
| MA20: | 75.43 | |
| MA50: | 74.27 | |
| MA100: | 73.33 | |
| MAexp7: | 75.97 | |
| MAexp20: | 76.02 | |
| MAexp50: | 76.20 | |
| MAexp100: | 75.84 | |
| Price / MA7: | +0.35% | |
| Price / MA20: | +1.71% | |
| Price / MA50: | +3.30% | |
| Price / MA100: | +4.62% | |
| Price / MAexp7: | +0.99% | |
| Price / MAexp20: | +0.92% | |
| Price / MAexp50: | +0.68% | |
| Price / MAexp100: | +1.16% |
News
Don't forget to follow the news on SS&C TECHNOLOGIES HLD.. At the time of publication of this analysis, the latest news was as follows:
- SS&C Technologies Releases Q3 2024 Earnings Results
- SS&C Technologies Unveils Innovative Solutions at Deliver 2024
- SS&C Technologies Completes Acquisition of Battea-Class Action Services
- SS&C Technologies to Acquire Battea-Class Action Services, Expanding Securities Class Action Claims Management Offerings
- SS&C Technologies Releases Q2 2024 Earnings Results, Announces $1 Billion Common Stock Repurchase Program
About author
Online


Add a comment
Comments
0 comments on the analysis SS&C TECHNOLOGIES HLD. - 1H