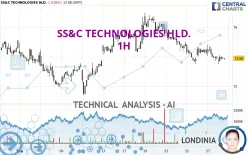
SS&C TECHNOLOGIES HLD. - 1H - Technical analysis published on 09/30/2024 (GMT)
- 146
- 0
Click here for a new analysis!
- Timeframe : 1H
- - Analysis generated on
- Status : LEVEL MAINTAINED

Summary of the analysis

Additional analysis
Quotes
SS&C TECHNOLOGIES HLD. rating 73.88 USD. The price is lower by -0.05% since the last closing with the lowest point at 73.49 USD and the highest point at 74.12 USD. The deviation from the price is +0.53% for the low point and -0.32% for the high point.The Central Gaps scanner detects a bearish opening marking the presence of sellers ahead of buyers at the opening but not sufficiently marked to allow the price to register a quotation gap.
Bearish opening
Type : Bearish
Timeframe : Openning
A study of price movements over other periods shows the following variations:
Near a new HIGH record (1 year)
Type : Bullish
Timeframe : Weekly
Near a new HIGH record (1st january)
Type : Bullish
Timeframe : Weekly
Near a new HIGH record (1 month)
Type : Bullish
Timeframe : Weekly
Technical
Technical analysis of this 1H chart of SS&C TECHNOLOGIES HLD. indicates that the overall trend is bearish. 71.43% of the signals given by moving averages are bearish. This bearish trend is slowing down slightly given the slightly bearish signals given by short-term moving averages. An assessment of moving averages reveals a bullish signal that could impact this trend:
Bullish trend reversal : Moving Average 20
Type : Bullish
Timeframe : 1 hour
An assessment of technical indicators does not currently provide any relevant information to suggest whether the signal given by the technical indicators is more bullish or bearish.
The Central Indicators scanner found no further results concerning independent technical indicators.
Central Patterns, the market scanner focusing on chart patterns, resistances and supports found this result:
Near support of channel
Type : Bullish
Timeframe : 1 hour
From the Japanese candlestick perspective, the Central Candlesticks scanner notes the presence of these results that could impact the short-term trend:
Black hanging man / hammer
Type : Neutral
Timeframe : 1 hour
Bullish engulfing lines
Type : Bullish
Timeframe : 1 hour
| S3 | S2 | S1 | Price | R1 | R2 | R3 | |
|---|---|---|---|---|---|---|---|
| ProTrendLines | 71.40 | 72.10 | 73.52 | 73.88 | 74.84 | 75.86 | 76.78 |
| Change (%) | -3.36% | -2.41% | -0.49% | - | +1.30% | +2.68% | +3.93% |
| Change | -2.48 | -1.78 | -0.36 | - | +0.96 | +1.98 | +2.90 |
| Level | Minor | Major | Major | - | Major | Minor | Major |
Pivot points can also be used to set your price objectives. Here is the price situation in relation to pivot points:
| Pivot points | S3 | S2 | S1 | PP | R1 | R2 | R3 |
|---|---|---|---|---|---|---|---|
| Standard | 72.42 | 73.07 | 73.50 | 74.15 | 74.58 | 75.23 | 75.66 |
| Camarilla | 73.62 | 73.72 | 73.82 | 73.92 | 74.02 | 74.12 | 74.22 |
| Woodie | 72.30 | 73.02 | 73.38 | 74.10 | 74.46 | 75.18 | 75.54 |
| Fibonacci | 73.07 | 73.49 | 73.74 | 74.15 | 74.57 | 74.82 | 75.23 |
| Pivot points | S3 | S2 | S1 | PP | R1 | R2 | R3 |
|---|---|---|---|---|---|---|---|
| Standard | 70.22 | 71.87 | 72.89 | 74.54 | 75.56 | 77.21 | 78.23 |
| Camarilla | 73.19 | 73.43 | 73.68 | 73.92 | 74.17 | 74.41 | 74.65 |
| Woodie | 69.92 | 71.71 | 72.59 | 74.38 | 75.26 | 77.05 | 77.93 |
| Fibonacci | 71.87 | 72.89 | 73.52 | 74.54 | 75.56 | 76.19 | 77.21 |
| Pivot points | S3 | S2 | S1 | PP | R1 | R2 | R3 |
|---|---|---|---|---|---|---|---|
| Standard | 63.89 | 66.09 | 70.46 | 72.66 | 77.03 | 79.23 | 83.60 |
| Camarilla | 73.03 | 73.64 | 74.24 | 74.84 | 75.44 | 76.05 | 76.65 |
| Woodie | 64.99 | 66.63 | 71.56 | 73.20 | 78.13 | 79.77 | 84.70 |
| Fibonacci | 66.09 | 68.60 | 70.15 | 72.66 | 75.17 | 76.72 | 79.23 |
Numerical data
The following are the details of the technical indicators and moving averages that were collected to generate this technical analysis:
| RSI (14): | 40.84 | |
| MACD (12,26,9): | -0.2300 | |
| Directional Movement: | -8.84 | |
| AROON (14): | -50.00 | |
| DEMA (21): | 73.84 | |
| Parabolic SAR (0,02-0,02-0,2): | 74.50 | |
| Elder Ray (13): | -0.12 | |
| Super Trend (3,10): | 74.71 | |
| Zig ZAG (10): | 73.90 | |
| VORTEX (21): | 0.9500 | |
| Stochastique (14,3,5): | 32.07 | |
| TEMA (21): | 73.82 | |
| Williams %R (14): | -68.94 | |
| Chande Momentum Oscillator (20): | -0.39 | |
| Repulse (5,40,3): | 0.0300 | |
| ROCnROLL: | 2 | |
| TRIX (15,9): | -0.0500 | |
| Courbe Coppock: | 0.92 |
| MA7: | 74.54 | |
| MA20: | 74.25 | |
| MA50: | 72.61 | |
| MA100: | 67.57 | |
| MAexp7: | 73.94 | |
| MAexp20: | 74.15 | |
| MAexp50: | 74.48 | |
| MAexp100: | 74.40 | |
| Price / MA7: | -0.89% | |
| Price / MA20: | -0.50% | |
| Price / MA50: | +1.75% | |
| Price / MA100: | +9.34% | |
| Price / MAexp7: | -0.08% | |
| Price / MAexp20: | -0.36% | |
| Price / MAexp50: | -0.81% | |
| Price / MAexp100: | -0.70% |
News
The latest news and videos published on SS&C TECHNOLOGIES HLD. at the time of the analysis were as follows:
- SS&C Technologies Completes Acquisition of Battea-Class Action Services
- SS&C Technologies to Acquire Battea-Class Action Services, Expanding Securities Class Action Claims Management Offerings
- SS&C Technologies Releases Q2 2024 Earnings Results, Announces $1 Billion Common Stock Repurchase Program
- SS&C Technologies Releases Q1 2024 Earnings Results
- SS&C Technologies Releases Q4 and Full Year 2023 Earnings Results
About author
Online


Add a comment
Comments
0 comments on the analysis SS&C TECHNOLOGIES HLD. - 1H