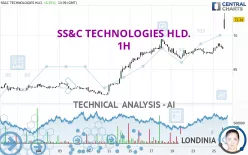
SS&C TECHNOLOGIES HLD. - 1H - Technical analysis published on 07/26/2024 (GMT)
- 121
- 0
Click here for a new analysis!
- Timeframe : 1H
- - Analysis generated on
- Status : LEVEL MAINTAINED

Summary of the analysis

Additional analysis
Quotes
SS&C TECHNOLOGIES HLD. rating 73.10 USD. The price has increased by +7.47% since the last closing with the lowest point at 70.90 USD and the highest point at 73.20 USD. The deviation from the price is +3.10% for the low point and -0.14% for the high point.The Central Gaps scanner detects a bullish opening marking the presence of buyers ahead of sellers at the opening but not sufficiently marked to allow the price to register a quotation gap.
Bullish opening
Type : Bullish
Timeframe : Openning
A study of price movements over other periods shows the following variations:
Near a new HIGH record (1 year)
Type : Bullish
Timeframe : Weekly
Near a new HIGH record (1st january)
Type : Bullish
Timeframe : Weekly
Near a new HIGH record (1 month)
Type : Bullish
Timeframe : Weekly
Technical
A technical analysis in 1H of this SS&C TECHNOLOGIES HLD. chart shows a strongly bullish trend. 92.86% of the signals given by moving averages are bullish. The overall trend is supported by the strong bullish signals from short-term moving averages. The Central Indicators scanner detects a bullish signal on moving averages that could impact this trend:
Bullish price crossover with adaptative moving average 20
Type : Bullish
Timeframe : 1 hour
In fact, 16 technical indicators on 18 studied are currently positioned bullish. Central Indicators, the scanner specialised in technical indicators, has identified these signals:
Pivot points : price is over resistance 3
Type : Neutral
Timeframe : 1 hour
Price is back over the pivot point
Type : Bullish
Timeframe : Weekly
Central Patterns, the scanner specializing in chart patterns, did not identify any signals.
For a small rebound in the very short term, the Central Candlesticks scanner currently notes the presence of this bullish pattern in Japanese candlesticks:
Long white line
Type : Bullish
Timeframe : 1 hour
| S3 | S2 | S1 | Price | R1 | R2 | |
|---|---|---|---|---|---|---|
| ProTrendLines | 67.18 | 68.44 | 70.13 | 73.10 | 75.69 | 81.20 |
| Change (%) | -8.10% | -6.37% | -4.06% | - | +3.54% | +11.08% |
| Change | -5.92 | -4.66 | -2.97 | - | +2.59 | +8.10 |
| Level | Intermediate | Major | Major | - | Minor | Major |
Attention could also be paid to pivot points to set price objectives:
| Pivot points | S3 | S2 | S1 | PP | R1 | R2 | R3 |
|---|---|---|---|---|---|---|---|
| Standard | 65.80 | 66.58 | 67.30 | 68.08 | 68.80 | 69.58 | 70.30 |
| Camarilla | 67.61 | 67.75 | 67.88 | 68.02 | 68.16 | 68.30 | 68.43 |
| Woodie | 65.77 | 66.57 | 67.27 | 68.07 | 68.77 | 69.57 | 70.27 |
| Fibonacci | 66.58 | 67.15 | 67.51 | 68.08 | 68.65 | 69.01 | 69.58 |
| Pivot points | S3 | S2 | S1 | PP | R1 | R2 | R3 |
|---|---|---|---|---|---|---|---|
| Standard | 60.05 | 62.52 | 64.54 | 67.01 | 69.03 | 71.50 | 73.52 |
| Camarilla | 65.32 | 65.73 | 66.14 | 66.55 | 66.96 | 67.37 | 67.79 |
| Woodie | 59.82 | 62.41 | 64.31 | 66.90 | 68.80 | 71.39 | 73.29 |
| Fibonacci | 62.52 | 64.24 | 65.30 | 67.01 | 68.73 | 69.79 | 71.50 |
| Pivot points | S3 | S2 | S1 | PP | R1 | R2 | R3 |
|---|---|---|---|---|---|---|---|
| Standard | 57.43 | 58.80 | 60.74 | 62.11 | 64.05 | 65.42 | 67.36 |
| Camarilla | 61.76 | 62.06 | 62.37 | 62.67 | 62.97 | 63.28 | 63.58 |
| Woodie | 57.71 | 58.94 | 61.02 | 62.25 | 64.33 | 65.56 | 67.64 |
| Fibonacci | 58.80 | 60.07 | 60.85 | 62.11 | 63.38 | 64.16 | 65.42 |
Numerical data
The following is the status of the technical indicators and moving averages at the time of publication of this technical analysis:
| RSI (14): | 79.78 | |
| MACD (12,26,9): | 0.5000 | |
| Directional Movement: | 46.14 | |
| AROON (14): | 100.00 | |
| DEMA (21): | 68.88 | |
| Parabolic SAR (0,02-0,02-0,2): | 67.69 | |
| Elder Ray (13): | 3.32 | |
| Super Trend (3,10): | 69.25 | |
| Zig ZAG (10): | 72.02 | |
| VORTEX (21): | 1.0600 | |
| Stochastique (14,3,5): | 70.38 | |
| TEMA (21): | 69.36 | |
| Williams %R (14): | -3.14 | |
| Chande Momentum Oscillator (20): | 5.44 | |
| Repulse (5,40,3): | 3.0800 | |
| ROCnROLL: | 1 | |
| TRIX (15,9): | 0.0500 | |
| Courbe Coppock: | 4.27 |
| MA7: | 68.26 | |
| MA20: | 65.27 | |
| MA50: | 63.32 | |
| MA100: | 62.74 | |
| MAexp7: | 69.42 | |
| MAexp20: | 68.37 | |
| MAexp50: | 67.57 | |
| MAexp100: | 66.32 | |
| Price / MA7: | +7.09% | |
| Price / MA20: | +12.00% | |
| Price / MA50: | +15.45% | |
| Price / MA100: | +16.51% | |
| Price / MAexp7: | +5.30% | |
| Price / MAexp20: | +6.92% | |
| Price / MAexp50: | +8.18% | |
| Price / MAexp100: | +10.22% |
News
The latest news and videos published on SS&C TECHNOLOGIES HLD. at the time of the analysis were as follows:
- SS&C Technologies Releases Q2 2024 Earnings Results, Announces $1 Billion Common Stock Repurchase Program
- SS&C Technologies Releases Q1 2024 Earnings Results
- SS&C Technologies Releases Q4 and Full Year 2023 Earnings Results
- SS&C Technologies Welcomes Seasoned Global Business Leader Debra Walton-Ruskin to its Board of Directors
- SS&C Technologies Releases Q3 2023 Earnings Results
About author
Online


Add a comment
Comments
0 comments on the analysis SS&C TECHNOLOGIES HLD. - 1H