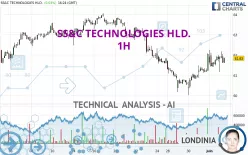
SS&C TECHNOLOGIES HLD. - 1H - Technical analysis published on 06/04/2024 (GMT)
- 120
- 0
Click here for a new analysis!
- Timeframe : 1H
- - Analysis generated on
- Status : TARGET REACHED

Summary of the analysis

Additional analysis
Quotes
SS&C TECHNOLOGIES HLD. rating 61.77 USD. On the day, this instrument lost -0.07% with the lowest point at 61.16 USD and the highest point at 62.18 USD. The deviation from the price is +1.00% for the low point and -0.66% for the high point.The Central Gaps scanner detects a bullish opening marking the presence of buyers ahead of sellers at the opening but not sufficiently marked to allow the price to register a quotation gap.
Bullish opening
Type : Bullish
Timeframe : Openning
So that you have an overall view of the price change, here is a table showing the variations over several periods:
Near a new LOW record (1st january)
Type : Bearish
Timeframe : Weekly
Near a new HIGH record (1 month)
Type : Bullish
Timeframe : Weekly
Technical
A technical analysis in 1H of this SS&C TECHNOLOGIES HLD. chart shows a neutral trend. The trend could quickly turn bullish due to the strong bullish signals currently being given by short-term moving averages. The Central Indicators scanner detects a bearish signal on moving averages that could impact this trend:
Bearish trend reversal : adaptative moving average 100
Type : Bearish
Timeframe : 1 hour
An assessment of technical indicators shows a moderate bullish signal.
The Central Indicators scanner found no further results concerning independent technical indicators.
The Central Patterns scanner, which studies chart patterns, resistances and supports, has identified this signal:
Near resistance of triangle
Type : Bearish
Timeframe : 1 hour
For a small rebound in the very short term, the Central Candlesticks scanner currently notes the presence of this bullish pattern in Japanese candlesticks:
Bullish harami
Type : Bullish
Timeframe : 1 hour
| S3 | S2 | S1 | Price | R1 | R2 | R3 | |
|---|---|---|---|---|---|---|---|
| ProTrendLines | 60.22 | 60.82 | 61.48 | 61.77 | 61.92 | 62.24 | 62.90 |
| Change (%) | -2.51% | -1.54% | -0.47% | - | +0.24% | +0.76% | +1.83% |
| Change | -1.55 | -0.95 | -0.29 | - | +0.15 | +0.47 | +1.13 |
| Level | Minor | Major | Minor | - | Major | Major | Minor |
Attention could also be paid to pivot points to set price objectives:
| Pivot points | S3 | S2 | S1 | PP | R1 | R2 | R3 |
|---|---|---|---|---|---|---|---|
| Standard | 60.54 | 60.97 | 61.39 | 61.82 | 62.24 | 62.67 | 63.09 |
| Camarilla | 61.58 | 61.65 | 61.73 | 61.81 | 61.89 | 61.97 | 62.04 |
| Woodie | 60.54 | 60.97 | 61.39 | 61.82 | 62.24 | 62.67 | 63.09 |
| Fibonacci | 60.97 | 61.30 | 61.50 | 61.82 | 62.15 | 62.35 | 62.67 |
| Pivot points | S3 | S2 | S1 | PP | R1 | R2 | R3 |
|---|---|---|---|---|---|---|---|
| Standard | 58.36 | 59.07 | 60.43 | 61.14 | 62.50 | 63.21 | 64.57 |
| Camarilla | 61.23 | 61.42 | 61.61 | 61.80 | 61.99 | 62.18 | 62.37 |
| Woodie | 58.70 | 59.23 | 60.77 | 61.30 | 62.84 | 63.37 | 64.91 |
| Fibonacci | 59.07 | 59.86 | 60.35 | 61.14 | 61.93 | 62.42 | 63.21 |
| Pivot points | S3 | S2 | S1 | PP | R1 | R2 | R3 |
|---|---|---|---|---|---|---|---|
| Standard | 55.72 | 57.75 | 59.77 | 61.80 | 63.82 | 65.85 | 67.87 |
| Camarilla | 60.69 | 61.06 | 61.43 | 61.80 | 62.17 | 62.54 | 62.91 |
| Woodie | 55.73 | 57.75 | 59.78 | 61.80 | 63.83 | 65.85 | 67.88 |
| Fibonacci | 57.75 | 59.29 | 60.25 | 61.80 | 63.34 | 64.30 | 65.85 |
Numerical data
The following is the status of the technical indicators and moving averages at the time of publication of this technical analysis:
| RSI (14): | 57.41 | |
| MACD (12,26,9): | 0.2100 | |
| Directional Movement: | 3.78 | |
| AROON (14): | 28.57 | |
| DEMA (21): | 61.72 | |
| Parabolic SAR (0,02-0,02-0,2): | 62.19 | |
| Elder Ray (13): | 0.08 | |
| Super Trend (3,10): | 60.87 | |
| Zig ZAG (10): | 61.73 | |
| VORTEX (21): | 1.1300 | |
| Stochastique (14,3,5): | 63.37 | |
| TEMA (21): | 61.98 | |
| Williams %R (14): | -40.70 | |
| Chande Momentum Oscillator (20): | 0.72 | |
| Repulse (5,40,3): | -0.2800 | |
| ROCnROLL: | 1 | |
| TRIX (15,9): | 0.0400 | |
| Courbe Coppock: | 2.50 |
| MA7: | 61.22 | |
| MA20: | 62.33 | |
| MA50: | 62.03 | |
| MA100: | 61.91 | |
| MAexp7: | 61.73 | |
| MAexp20: | 61.48 | |
| MAexp50: | 61.47 | |
| MAexp100: | 61.73 | |
| Price / MA7: | +0.90% | |
| Price / MA20: | -0.90% | |
| Price / MA50: | -0.42% | |
| Price / MA100: | -0.23% | |
| Price / MAexp7: | +0.06% | |
| Price / MAexp20: | +0.47% | |
| Price / MAexp50: | +0.49% | |
| Price / MAexp100: | +0.06% |
News
The last news published on SS&C TECHNOLOGIES HLD. at the time of the generation of this analysis was as follows:
- SS&C Technologies Releases Q1 2024 Earnings Results
- SS&C Technologies Releases Q4 and Full Year 2023 Earnings Results
- SS&C Technologies Welcomes Seasoned Global Business Leader Debra Walton-Ruskin to its Board of Directors
- SS&C Technologies Releases Q3 2023 Earnings Results
- SS&C Technologies Propels Financial Services into the Future with Groundbreaking Solutions Unveiled at Deliver 2023
About author
Online


Add a comment
Comments
0 comments on the analysis SS&C TECHNOLOGIES HLD. - 1H