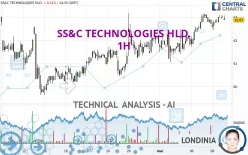
SS&C TECHNOLOGIES HLD. - 1H - Technical analysis published on 05/09/2024 (GMT)
- 157
- 0
Click here for a new analysis!
- Timeframe : 1H
- - Analysis generated on
- Status : LEVEL MAINTAINED

Summary of the analysis

Additional analysis
Quotes
The SS&C TECHNOLOGIES HLD. price is 62.96 USD. The price is lower by -0.06% since the last closing and was between 62.92 USD and 63.06 USD. This implies that the price is at +0.06% from its lowest and at -0.16% from its highest.A study of price movements over other periods shows the following variations:
Near a new HIGH record (1 year)
Type : Bullish
Timeframe : Weekly
Near a new HIGH record (1st january)
Type : Bullish
Timeframe : Weekly
Near a new HIGH record (1 month)
Type : Bullish
Timeframe : Weekly
Technical
A technical analysis in 1H of this SS&C TECHNOLOGIES HLD. chart shows a strongly bullish trend. The signals given by the moving averages are 92.86% bullish. This strong bullish trend is confirmed by the strong signals currently being given by short-term moving averages. There is no crossing of moving average by the price or crossing of moving averages between themselves.
The probability of a further increase is slight given the direction of the technical indicators.
Central Indicators, the detector scanner for these technical indicators recently detected a signal:
Pivot points : price is over resistance 1
Type : Neutral
Timeframe : Weekly
The analysis of the price chart with Central Patterns scanners does not return any result.
Central Candlesticks, the scanner specialised in Japanese candlesticks, detects these signals that could have an impact on the current short-term trend:
Grip top and gravestone
Type : Bearish
Timeframe : 1 hour
Black hanging man / hammer
Type : Neutral
Timeframe : 1 hour
| S3 | S2 | S1 | Price | R1 | R2 | R3 | |
|---|---|---|---|---|---|---|---|
| ProTrendLines | 61.06 | 61.73 | 62.17 | 62.96 | 63.15 | 64.60 | 70.42 |
| Change (%) | -3.02% | -1.95% | -1.25% | - | +0.30% | +2.60% | +11.85% |
| Change | -1.90 | -1.23 | -0.79 | - | +0.19 | +1.64 | +7.46 |
| Level | Intermediate | Minor | Major | - | Intermediate | Intermediate | Intermediate |
Pivot points can also be used to set your price objectives. Here is the price situation in relation to pivot points:
| Pivot points | S3 | S2 | S1 | PP | R1 | R2 | R3 |
|---|---|---|---|---|---|---|---|
| Standard | 61.94 | 62.19 | 62.59 | 62.84 | 63.24 | 63.49 | 63.89 |
| Camarilla | 62.82 | 62.88 | 62.94 | 63.00 | 63.06 | 63.12 | 63.18 |
| Woodie | 62.03 | 62.23 | 62.68 | 62.88 | 63.33 | 63.53 | 63.98 |
| Fibonacci | 62.19 | 62.44 | 62.59 | 62.84 | 63.09 | 63.24 | 63.49 |
| Pivot points | S3 | S2 | S1 | PP | R1 | R2 | R3 |
|---|---|---|---|---|---|---|---|
| Standard | 59.68 | 60.37 | 61.09 | 61.78 | 62.50 | 63.19 | 63.91 |
| Camarilla | 61.42 | 61.55 | 61.68 | 61.81 | 61.94 | 62.07 | 62.20 |
| Woodie | 59.70 | 60.38 | 61.11 | 61.79 | 62.52 | 63.20 | 63.93 |
| Fibonacci | 60.37 | 60.91 | 61.24 | 61.78 | 62.32 | 62.65 | 63.19 |
| Pivot points | S3 | S2 | S1 | PP | R1 | R2 | R3 |
|---|---|---|---|---|---|---|---|
| Standard | 54.60 | 57.12 | 59.50 | 62.02 | 64.40 | 66.92 | 69.30 |
| Camarilla | 60.54 | 60.99 | 61.44 | 61.89 | 62.34 | 62.79 | 63.24 |
| Woodie | 54.54 | 57.09 | 59.44 | 61.99 | 64.34 | 66.89 | 69.24 |
| Fibonacci | 57.12 | 58.99 | 60.15 | 62.02 | 63.89 | 65.05 | 66.92 |
Numerical data
The following is the status of the technical indicators and moving averages at the time of publication of this technical analysis:
| RSI (14): | 59.86 | |
| MACD (12,26,9): | 0.2100 | |
| Directional Movement: | 4.16 | |
| AROON (14): | -50.00 | |
| DEMA (21): | 63.05 | |
| Parabolic SAR (0,02-0,02-0,2): | 63.07 | |
| Elder Ray (13): | 0.14 | |
| Super Trend (3,10): | 62.36 | |
| Zig ZAG (10): | 63.02 | |
| VORTEX (21): | 1.2300 | |
| Stochastique (14,3,5): | 80.68 | |
| TEMA (21): | 63.07 | |
| Williams %R (14): | -18.57 | |
| Chande Momentum Oscillator (20): | 0.05 | |
| Repulse (5,40,3): | 0.1300 | |
| ROCnROLL: | 1 | |
| TRIX (15,9): | 0.0600 | |
| Courbe Coppock: | 0.54 |
| MA7: | 62.29 | |
| MA20: | 61.49 | |
| MA50: | 62.44 | |
| MA100: | 61.76 | |
| MAexp7: | 62.94 | |
| MAexp20: | 62.74 | |
| MAexp50: | 62.35 | |
| MAexp100: | 62.07 | |
| Price / MA7: | +1.08% | |
| Price / MA20: | +2.39% | |
| Price / MA50: | +0.83% | |
| Price / MA100: | +1.94% | |
| Price / MAexp7: | +0.03% | |
| Price / MAexp20: | +0.35% | |
| Price / MAexp50: | +0.98% | |
| Price / MAexp100: | +1.43% |
News
Don't forget to follow the news on SS&C TECHNOLOGIES HLD.. At the time of publication of this analysis, the latest news was as follows:
- SS&C Technologies Releases Q1 2024 Earnings Results
- SS&C Technologies Releases Q4 and Full Year 2023 Earnings Results
- SS&C Technologies Welcomes Seasoned Global Business Leader Debra Walton-Ruskin to its Board of Directors
- SS&C Technologies Releases Q3 2023 Earnings Results
- SS&C Technologies Propels Financial Services into the Future with Groundbreaking Solutions Unveiled at Deliver 2023
About author
Online


Add a comment
Comments
0 comments on the analysis SS&C TECHNOLOGIES HLD. - 1H