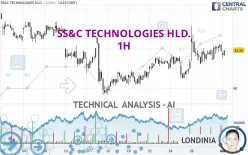
SS&C TECHNOLOGIES HLD. - 1H - Technical analysis published on 05/01/2024 (GMT)
- 150
- 0
Click here for a new analysis!
- Timeframe : 1H
- - Analysis generated on
- Status : TARGET REACHED

Summary of the analysis

Additional analysis
Quotes
The SS&C TECHNOLOGIES HLD. rating is 61.86 USD. On the day, this instrument lost -0.05% and was traded between 61.50 USD and 61.90 USD over the period. The price is currently at +0.59% from its lowest and -0.06% from its highest.The Central Gaps scanner detects a bearish opening. A small advantage for sellers in the very short term.
Bearish opening
Type : Bearish
Timeframe : Openning
Here is a more detailed summary of the historical variations registered by SS&C TECHNOLOGIES HLD.:
Near a new LOW record (1st january)
Type : Bearish
Timeframe : Weekly
Near a new LOW record (1 month)
Type : Bearish
Timeframe : Weekly
Technical
A technical analysis in 1H of this SS&C TECHNOLOGIES HLD. chart shows a bullish trend. 71.43% of the signals given by moving averages are bullish. This bullish trend shows slight signs of slowing down given the slightly bullish signals given by the short-term moving averages. An assessment of moving averages reveals a bullish signal that could impact this trend:
Bullish price crossover with Moving Average 20
Type : Bullish
Timeframe : 1 hour
The technical indicators are generally neutral. They do not provide relevant information on the direction of future price movements.
Central Indicators, the scanner specialised in technical indicators, has identified these signals:
RSI indicator is back over 50
Type : Bullish
Timeframe : 1 hour
Price is back over the pivot point
Type : Bullish
Timeframe : Weekly
Williams %R indicator is back over -50
Type : Bullish
Timeframe : 1 hour
The Central Patterns scanner, which studies chart patterns, resistances and supports, has identified these signals:
Near resistance of triangle
Type : Bearish
Timeframe : 1 hour
Near support of channel
Type : Bullish
Timeframe : 1 hour
The presence of a bullish Japanese candlestick pattern detected by Central Candlesticks that could cause a very short term rebound was also detected:
Bullish engulfing lines
Type : Bullish
Timeframe : 1 hour
| S3 | S2 | S1 | Price | R1 | R2 | R3 | |
|---|---|---|---|---|---|---|---|
| ProTrendLines | 59.91 | 60.46 | 61.47 | 61.86 | 62.17 | 63.39 | 64.60 |
| Change (%) | -3.15% | -2.26% | -0.63% | - | +0.50% | +2.47% | +4.43% |
| Change | -1.95 | -1.40 | -0.39 | - | +0.31 | +1.53 | +2.74 |
| Level | Major | Intermediate | Minor | - | Major | Major | Major |
To determine price objectives, it is also possible to use the pivot points. Here is the price position in relation to pivot points:
| Pivot points | S3 | S2 | S1 | PP | R1 | R2 | R3 |
|---|---|---|---|---|---|---|---|
| Standard | 60.69 | 61.07 | 61.48 | 61.86 | 62.27 | 62.65 | 63.06 |
| Camarilla | 61.67 | 61.75 | 61.82 | 61.89 | 61.96 | 62.04 | 62.11 |
| Woodie | 60.71 | 61.08 | 61.50 | 61.87 | 62.29 | 62.66 | 63.08 |
| Fibonacci | 61.07 | 61.37 | 61.56 | 61.86 | 62.16 | 62.35 | 62.65 |
| Pivot points | S3 | S2 | S1 | PP | R1 | R2 | R3 |
|---|---|---|---|---|---|---|---|
| Standard | 57.37 | 58.91 | 60.08 | 61.62 | 62.79 | 64.33 | 65.50 |
| Camarilla | 60.50 | 60.74 | 60.99 | 61.24 | 61.49 | 61.74 | 61.99 |
| Woodie | 57.18 | 58.82 | 59.89 | 61.53 | 62.60 | 64.24 | 65.31 |
| Fibonacci | 58.91 | 59.95 | 60.59 | 61.62 | 62.66 | 63.30 | 64.33 |
| Pivot points | S3 | S2 | S1 | PP | R1 | R2 | R3 |
|---|---|---|---|---|---|---|---|
| Standard | 54.60 | 57.12 | 59.50 | 62.02 | 64.40 | 66.92 | 69.30 |
| Camarilla | 60.54 | 60.99 | 61.44 | 61.89 | 62.34 | 62.79 | 63.24 |
| Woodie | 54.54 | 57.09 | 59.44 | 61.99 | 64.34 | 66.89 | 69.24 |
| Fibonacci | 57.12 | 58.99 | 60.15 | 62.02 | 63.89 | 65.05 | 66.92 |
Numerical data
The following are the details of the technical indicators and moving averages that were collected to generate this technical analysis:
| RSI (14): | 50.25 | |
| MACD (12,26,9): | 0.1300 | |
| Directional Movement: | -3.24 | |
| AROON (14): | 78.57 | |
| DEMA (21): | 61.98 | |
| Parabolic SAR (0,02-0,02-0,2): | 61.43 | |
| Elder Ray (13): | -0.15 | |
| Super Trend (3,10): | 60.97 | |
| Zig ZAG (10): | 61.78 | |
| VORTEX (21): | 0.9600 | |
| Stochastique (14,3,5): | 51.77 | |
| TEMA (21): | 61.99 | |
| Williams %R (14): | -49.45 | |
| Chande Momentum Oscillator (20): | 0.09 | |
| Repulse (5,40,3): | 0.2600 | |
| ROCnROLL: | -1 | |
| TRIX (15,9): | 0.0400 | |
| Courbe Coppock: | 0.82 |
| MA7: | 61.52 | |
| MA20: | 61.49 | |
| MA50: | 62.62 | |
| MA100: | 61.51 | |
| MAexp7: | 61.88 | |
| MAexp20: | 61.78 | |
| MAexp50: | 61.54 | |
| MAexp100: | 61.55 | |
| Price / MA7: | +0.55% | |
| Price / MA20: | +0.60% | |
| Price / MA50: | -1.21% | |
| Price / MA100: | +0.57% | |
| Price / MAexp7: | -0.03% | |
| Price / MAexp20: | +0.13% | |
| Price / MAexp50: | +0.52% | |
| Price / MAexp100: | +0.50% |
News
The latest news and videos published on SS&C TECHNOLOGIES HLD. at the time of the analysis were as follows:
- SS&C Technologies Releases Q1 2024 Earnings Results
- SS&C Technologies Releases Q4 and Full Year 2023 Earnings Results
- SS&C Technologies Welcomes Seasoned Global Business Leader Debra Walton-Ruskin to its Board of Directors
- SS&C Technologies Releases Q3 2023 Earnings Results
- SS&C Technologies Propels Financial Services into the Future with Groundbreaking Solutions Unveiled at Deliver 2023
About author
Online


Add a comment
Comments
0 comments on the analysis SS&C TECHNOLOGIES HLD. - 1H