SS&C TECHNOLOGIES HLD. - 1H - Technical analysis published on 01/23/2024 (GMT)
- 152
- 0
Click here for a new analysis!
- Timeframe : 1H
- - Analysis generated on
- Status : INVALID

Summary of the analysis

Additional analysis
Quotes
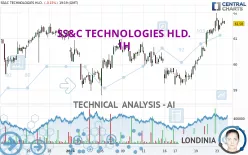
The SS&C TECHNOLOGIES HLD. price is 61.62 USD. On the day, this instrument lost -0.08% and was traded between 61.28 USD and 61.99 USD over the period. The price is currently at +0.55% from its lowest and -0.60% from its highest.A bullish gap was detected at the opening by the Central Gaps scanner. There are a lot of buyers and they have the upper hand in the very short term.
Opening Gap UP
Type : Bullish
Timeframe : Openning
A study of price movements over other periods shows the following variations:
Near a new HIGH record (1 year)
Type : Bullish
Timeframe : Weekly
New HIGH record (1st january)
Type : Bullish
Timeframe : Weekly
New HIGH record (1 month)
Type : Bullish
Timeframe : Weekly
Technical
Technical analysis of this 1H chart of SS&C TECHNOLOGIES HLD. indicates that the overall trend is strongly bullish. 92.86% of the signals given by moving averages are bullish. The overall trend is supported by the strong bullish signals from short-term moving averages. The Central Indicators scanner does not detect any result on moving averages that would impact this trend.
In fact, according to the parameters integrated into the Central Analyzer system, 12 technical indicators out of 18 analysed are currently bullish. Caution: the Central Indicators scanner currently detects an excess:
MACD indicator: bearish divergence
Type : Bearish
Timeframe : 1 hour
Pivot points : price is over resistance 2
Type : Neutral
Timeframe : Weekly
An analysis of the price chart with the Central Patterns scanner (detector of chart patterns and resistances and supports) shows several results that can have an impact on the price change:
Near horizontal resistance
Type : Bearish
Timeframe : 1 hour
Resistance of channel is broken
Type : Bullish
Timeframe : 1 hour
No result was found by the Central Candlesticks scanner on Japanese candlesticks.
| S3 | S2 | S1 | Price | R1 | R2 | R3 | |
|---|---|---|---|---|---|---|---|
| ProTrendLines | 59.34 | 60.99 | 61.58 | 61.62 | 62.33 | 66.72 | 72.19 |
| Change (%) | -3.70% | -1.02% | -0.06% | - | +1.15% | +8.28% | +17.15% |
| Change | -2.28 | -0.63 | -0.04 | - | +0.71 | +5.10 | +10.57 |
| Level | Major | Intermediate | Minor | - | Major | Minor | Minor |
Attention could also be paid to pivot points to set price objectives:
| Pivot points | S3 | S2 | S1 | PP | R1 | R2 | R3 |
|---|---|---|---|---|---|---|---|
| Standard | 59.96 | 60.32 | 60.99 | 61.35 | 62.02 | 62.38 | 63.05 |
| Camarilla | 61.39 | 61.48 | 61.58 | 61.67 | 61.76 | 61.86 | 61.95 |
| Woodie | 60.13 | 60.40 | 61.16 | 61.43 | 62.19 | 62.46 | 63.22 |
| Fibonacci | 60.32 | 60.71 | 60.95 | 61.35 | 61.74 | 61.98 | 62.38 |
| Pivot points | S3 | S2 | S1 | PP | R1 | R2 | R3 |
|---|---|---|---|---|---|---|---|
| Standard | 58.06 | 58.62 | 59.57 | 60.13 | 61.08 | 61.64 | 62.59 |
| Camarilla | 60.11 | 60.24 | 60.38 | 60.52 | 60.66 | 60.80 | 60.94 |
| Woodie | 58.26 | 58.72 | 59.77 | 60.23 | 61.28 | 61.74 | 62.79 |
| Fibonacci | 58.62 | 59.20 | 59.55 | 60.13 | 60.71 | 61.06 | 61.64 |
| Pivot points | S3 | S2 | S1 | PP | R1 | R2 | R3 |
|---|---|---|---|---|---|---|---|
| Standard | 51.78 | 53.84 | 57.47 | 59.53 | 63.16 | 65.22 | 68.85 |
| Camarilla | 59.55 | 60.07 | 60.59 | 61.11 | 61.63 | 62.15 | 62.68 |
| Woodie | 52.58 | 54.23 | 58.27 | 59.92 | 63.96 | 65.61 | 69.65 |
| Fibonacci | 53.84 | 56.01 | 57.35 | 59.53 | 61.70 | 63.04 | 65.22 |
Numerical data
The following is the status of the technical indicators and moving averages at the time of publication of this technical analysis:
| RSI (14): | 70.83 | |
| MACD (12,26,9): | 0.4300 | |
| Directional Movement: | 27.35 | |
| AROON (14): | 57.15 | |
| DEMA (21): | 61.66 | |
| Parabolic SAR (0,02-0,02-0,2): | 61.48 | |
| Elder Ray (13): | 0.33 | |
| Super Trend (3,10): | 60.90 | |
| Zig ZAG (10): | 61.63 | |
| VORTEX (21): | 1.3400 | |
| Stochastique (14,3,5): | 77.34 | |
| TEMA (21): | 61.89 | |
| Williams %R (14): | -24.04 | |
| Chande Momentum Oscillator (20): | 0.41 | |
| Repulse (5,40,3): | 0.0500 | |
| ROCnROLL: | 1 | |
| TRIX (15,9): | 0.1000 | |
| Courbe Coppock: | 3.58 |
| MA7: | 60.45 | |
| MA20: | 60.48 | |
| MA50: | 58.17 | |
| MA100: | 55.40 | |
| MAexp7: | 61.54 | |
| MAexp20: | 61.11 | |
| MAexp50: | 60.60 | |
| MAexp100: | 60.33 | |
| Price / MA7: | +1.94% | |
| Price / MA20: | +1.88% | |
| Price / MA50: | +5.93% | |
| Price / MA100: | +11.23% | |
| Price / MAexp7: | +0.13% | |
| Price / MAexp20: | +0.83% | |
| Price / MAexp50: | +1.68% | |
| Price / MAexp100: | +2.14% |
News
The latest news and videos published on SS&C TECHNOLOGIES HLD. at the time of the analysis were as follows:
- SS&C Technologies Welcomes Seasoned Global Business Leader Debra Walton-Ruskin to its Board of Directors
- SS&C Technologies Releases Q3 2023 Earnings Results
- SS&C Technologies Propels Financial Services into the Future with Groundbreaking Solutions Unveiled at Deliver 2023
- SS&C Technologies Releases Q2 2023 Earnings Results, Announces $1 Billion Common Stock Repurchase Program
- SS&C Technologies Releases Q1 2023 Earnings Results
About author
Online


Add a comment
Comments
0 comments on the analysis SS&C TECHNOLOGIES HLD. - 1H