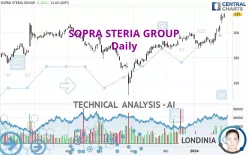
SOPRA STERIA GROUP - Daily - Technical analysis published on 01/30/2024 (GMT)
- 190
- 0
Click here for a new analysis!
- Timeframe : Daily
- - Analysis generated on
- Status : TARGET REACHED

Summary of the analysis

Additional analysis
Quotes
SOPRA STERIA GROUP rating 215.0 EUR. The price registered an increase of +1.61% on the session with the lowest point at 211.6 EUR and the highest point at 215.2 EUR. The deviation from the price is +1.61% for the low point and -0.09% for the high point.The Central Gaps scanner detects a bullish opening marking the presence of buyers ahead of sellers at the opening but not sufficiently marked to allow the price to register a quotation gap.
Bullish opening
Type : Bullish
Timeframe : Openning
Here is a more detailed summary of the historical variations registered by SOPRA STERIA GROUP:
Near a new HIGH record (5 years)
Type : Bullish
Timeframe : Weekly
Near a new HIGH record (1 year)
Type : Bullish
Timeframe : Weekly
Near a new HIGH record (1st january)
Type : Bullish
Timeframe : Weekly
Near a new HIGH record (1 month)
Type : Bullish
Timeframe : Weekly
Technical
Technical analysis of this Daily chart of SOPRA STERIA GROUP indicates that the overall trend is strongly bullish. 92.86% of the signals given by moving averages are bullish. The overall trend is supported by the strong bullish signals from short-term moving averages. The Central Indicators market scanner currently does not detect any result that concerns moving averages.
In fact, according to the parameters integrated into the Central Analyzer system, 14 technical indicators out of 18 analysed are currently bullish. Caution: the Central Indicators scanner currently detects an excess:
RSI indicator is overbought : over 70
Type : Neutral
Timeframe : Daily
CCI indicator is overbought : over 100
Type : Neutral
Timeframe : Daily
Williams %R indicator is overbought : over -20
Type : Neutral
Timeframe : Daily
Pivot points : price is over resistance 2
Type : Neutral
Timeframe : Daily
Central Patterns, the market scanner focusing on chart patterns, resistances and supports found this result:
Resistance of channel is broken
Type : Bullish
Timeframe : Daily
The Central Candlesticks scanner which studies Japanese candlesticks did not detect anything.
| S3 | S2 | S1 | Price | |
|---|---|---|---|---|
| ProTrendLines | 171.5 | 189.7 | 207.2 | 215.0 |
| Change (%) | -20.23% | -11.77% | -3.63% | - |
| Change | -43.5 | -25.3 | -7.8 | - |
| Level | Major | Major | Major | - |
Pivot points can also be used to set your price objectives. Here is the price situation in relation to pivot points:
| Pivot points | S3 | S2 | S1 | PP | R1 | R2 | R3 |
|---|---|---|---|---|---|---|---|
| Standard | 207.7 | 209.1 | 210.3 | 211.7 | 212.9 | 214.3 | 215.5 |
| Camarilla | 210.9 | 211.1 | 211.4 | 211.6 | 211.8 | 212.1 | 212.3 |
| Woodie | 207.7 | 209.1 | 210.3 | 211.7 | 212.9 | 214.3 | 215.5 |
| Fibonacci | 209.1 | 210.1 | 210.7 | 211.7 | 212.7 | 213.3 | 214.3 |
| Pivot points | S3 | S2 | S1 | PP | R1 | R2 | R3 |
|---|---|---|---|---|---|---|---|
| Standard | 177.7 | 185.6 | 199.8 | 207.7 | 221.9 | 229.8 | 244.0 |
| Camarilla | 207.9 | 210.0 | 212.0 | 214.0 | 216.0 | 218.1 | 220.1 |
| Woodie | 180.9 | 187.2 | 203.0 | 209.3 | 225.1 | 231.4 | 247.2 |
| Fibonacci | 185.6 | 194.0 | 199.3 | 207.7 | 216.1 | 221.4 | 229.8 |
| Pivot points | S3 | S2 | S1 | PP | R1 | R2 | R3 |
|---|---|---|---|---|---|---|---|
| Standard | 175.6 | 181.0 | 189.4 | 194.8 | 203.2 | 208.6 | 217.0 |
| Camarilla | 194.0 | 195.3 | 196.5 | 197.8 | 199.1 | 200.3 | 201.6 |
| Woodie | 177.1 | 181.8 | 190.9 | 195.6 | 204.7 | 209.4 | 218.5 |
| Fibonacci | 181.0 | 186.3 | 189.5 | 194.8 | 200.1 | 203.3 | 208.6 |
Numerical data
The following are the details of the technical indicators and moving averages that were collected to generate this technical analysis:
| RSI (14): | 73.30 | |
| MACD (12,26,9): | 5.0000 | |
| Directional Movement: | 27.5 | |
| AROON (14): | 50.0 | |
| DEMA (21): | 206.5 | |
| Parabolic SAR (0,02-0,02-0,2): | 195.0 | |
| Elder Ray (13): | 9.8 | |
| Super Trend (3,10): | 199.7 | |
| Zig ZAG (10): | 215.2 | |
| VORTEX (21): | 1.1000 | |
| Stochastique (14,3,5): | 91.70 | |
| TEMA (21): | 209.3 | |
| Williams %R (14): | -3.10 | |
| Chande Momentum Oscillator (20): | 18.9 | |
| Repulse (5,40,3): | 4.1000 | |
| ROCnROLL: | 1 | |
| TRIX (15,9): | 0.2000 | |
| Courbe Coppock: | 14.70 |
| MA7: | 207.2 | |
| MA20: | 197.8 | |
| MA50: | 194.4 | |
| MA100: | 189.0 | |
| MAexp7: | 207.9 | |
| MAexp20: | 200.8 | |
| MAexp50: | 195.1 | |
| MAexp100: | 191.6 | |
| Price / MA7: | +3.76% | |
| Price / MA20: | +8.70% | |
| Price / MA50: | +10.60% | |
| Price / MA100: | +13.76% | |
| Price / MAexp7: | +3.42% | |
| Price / MAexp20: | +7.07% | |
| Price / MAexp50: | +10.20% | |
| Price / MAexp100: | +12.21% |
News
Don't forget to follow the news on SOPRA STERIA GROUP. At the time of publication of this analysis, the latest news was as follows:
- Sopra Steria Group: Weekly Disclosure of Transactions in Own Shares From September 25Th to 29Th, 2023
- Sopra Steria Group: 2023 Half-Year Financial Report Now Available
- Sopra Steria: First-Half 2023
- Sopra Steria Group: Disclosure of the Total Number of Shares and Voting Rights as at 30 June 2023
- Sopra Steria Integrates Generative AI Tools Into Its Development Platforms
About author
Online


Add a comment
Comments
0 comments on the analysis SOPRA STERIA GROUP - Daily