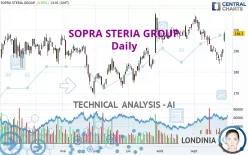
SOPRA STERIA GROUP - Daily - Technical analysis published on 09/29/2023 (GMT)
- 199
- 0
Click here for a new analysis!
- Timeframe : Daily
- - Analysis generated on
- Status : INVALID

Summary of the analysis

Additional analysis
Quotes
The SOPRA STERIA GROUP rating is 198.3 EUR. On the day, this instrument gained +3.93% and was traded between 194.1 EUR and 199.1 EUR over the period. The price is currently at +2.16% from its lowest and -0.40% from its highest.A bullish gap was detected at the opening by the Central Gaps scanner. There are a lot of buyers and they have the upper hand in the very short term.
Opening Gap UP
Type : Bullish
Timeframe : Openning
So that you have an overall view of the price change, here is a table showing the variations over several periods:
Near a new HIGH record (5 years)
Type : Bullish
Timeframe : Weekly
Near a new HIGH record (1 year)
Type : Bullish
Timeframe : Weekly
Near a new HIGH record (1st january)
Type : Bullish
Timeframe : Weekly
Near a new HIGH record (1 month)
Type : Bullish
Timeframe : Weekly
Technical
Technical analysis of SOPRA STERIA GROUP in Daily shows a strongly overall bullish trend. 82.14% of the signals given by moving averages are bullish. The slightly bullish signals given by the short-term moving averages show a weakening of the global trend. An assessment of moving averages reveals several bullish signals that could impact this trend:
Bullish trend reversal : Moving Average 50
Type : Bullish
Timeframe : Daily
Bullish trend reversal : adaptative moving average 100
Type : Bullish
Timeframe : Daily
Bullish price crossover with Moving Average 20
Type : Bullish
Timeframe : Daily
Bullish price crossover with Moving Average 50
Type : Bullish
Timeframe : Daily
Bullish price crossover with adaptative moving average 20
Type : Bullish
Timeframe : Daily
Bullish price crossover with adaptative moving average 50
Type : Bullish
Timeframe : Daily
On the 18 technical indicators analysed, 11 are bullish, 3 are neutral and 4 are bearish. Caution: the Central Indicators scanner currently detects an excess:
Williams %R indicator is overbought : over -20
Type : Neutral
Timeframe : Daily
Pivot points : price is over resistance 2
Type : Neutral
Timeframe : Weekly
Pivot points : price is over resistance 3
Type : Neutral
Timeframe : Daily
RSI indicator is back over 50
Type : Bullish
Timeframe : Daily
MACD crosses UP its Moving Average
Type : Bullish
Timeframe : Daily
Parabolic SAR indicator bullish reversal
Type : Bullish
Timeframe : Daily
Ichimoku : price is over the cloud
Type : Bullish
Timeframe : Daily
SuperTrend indicator bullish reversal
Type : Bullish
Timeframe : Daily
Momentum indicator is back over 0
Type : Bullish
Timeframe : Daily
Central Patterns, the market scanner focusing on chart patterns, resistances and supports found this result:
Resistance of channel is broken
Type : Bullish
Timeframe : Daily
Central Candlesticks, the scanner specialised in Japanese candlesticks, detects a bullish signal that could support the hypothesis of a small rebound in the very short term:
Upside gap
Type : Bullish
Timeframe : Daily
| S3 | S2 | S1 | Price | R1 | |
|---|---|---|---|---|---|
| ProTrendLines | 171.5 | 183.3 | 192.5 | 198.3 | 207.2 |
| Change (%) | -13.51% | -7.56% | -2.92% | - | +4.49% |
| Change | -26.8 | -15.0 | -5.8 | - | +8.9 |
| Level | Major | Major | Intermediate | - | Major |
To determine price objectives, it is also possible to use the pivot points. Here is the price position in relation to pivot points:
| Pivot points | S3 | S2 | S1 | PP | R1 | R2 | R3 |
|---|---|---|---|---|---|---|---|
| Standard | 184.5 | 185.9 | 188.3 | 189.7 | 192.1 | 193.5 | 195.9 |
| Camarilla | 189.8 | 190.1 | 190.5 | 190.8 | 191.2 | 191.5 | 191.9 |
| Woodie | 185.1 | 186.2 | 188.9 | 190.0 | 192.7 | 193.8 | 196.5 |
| Fibonacci | 185.9 | 187.3 | 188.2 | 189.7 | 191.1 | 192.0 | 193.5 |
| Pivot points | S3 | S2 | S1 | PP | R1 | R2 | R3 |
|---|---|---|---|---|---|---|---|
| Standard | 177.3 | 181.5 | 184.7 | 188.9 | 192.1 | 196.3 | 199.5 |
| Camarilla | 186.0 | 186.6 | 187.3 | 188.0 | 188.7 | 189.4 | 190.0 |
| Woodie | 176.9 | 181.3 | 184.3 | 188.7 | 191.7 | 196.1 | 199.1 |
| Fibonacci | 181.5 | 184.3 | 186.0 | 188.9 | 191.7 | 193.4 | 196.3 |
| Pivot points | S3 | S2 | S1 | PP | R1 | R2 | R3 |
|---|---|---|---|---|---|---|---|
| Standard | 187.0 | 190.4 | 196.8 | 200.2 | 206.6 | 210.0 | 216.4 |
| Camarilla | 200.5 | 201.4 | 202.3 | 203.2 | 204.1 | 205.0 | 205.9 |
| Woodie | 188.5 | 191.2 | 198.3 | 201.0 | 208.1 | 210.8 | 217.9 |
| Fibonacci | 190.4 | 194.1 | 196.5 | 200.2 | 203.9 | 206.3 | 210.0 |
Numerical data
The following is the status of technical indicators and moving averages registered at the time this technical analysis was created:
| RSI (14): | 57.30 | |
| MACD (12,26,9): | -1.8000 | |
| Directional Movement: | 9.8 | |
| AROON (14): | -78.6 | |
| DEMA (21): | 191.0 | |
| Parabolic SAR (0,02-0,02-0,2): | 183.8 | |
| Elder Ray (13): | 4.5 | |
| Super Trend (3,10): | 185.0 | |
| Zig ZAG (10): | 198.2 | |
| VORTEX (21): | 0.8000 | |
| Stochastique (14,3,5): | 54.20 | |
| TEMA (21): | 189.0 | |
| Williams %R (14): | -8.90 | |
| Chande Momentum Oscillator (20): | 2.4 | |
| Repulse (5,40,3): | 4.0000 | |
| ROCnROLL: | 1 | |
| TRIX (15,9): | -0.1000 | |
| Courbe Coppock: | 8.80 |
| MA7: | 189.8 | |
| MA20: | 194.2 | |
| MA50: | 196.3 | |
| MA100: | 188.6 | |
| MAexp7: | 191.7 | |
| MAexp20: | 193.2 | |
| MAexp50: | 193.5 | |
| MAexp100: | 189.2 | |
| Price / MA7: | +4.48% | |
| Price / MA20: | +2.11% | |
| Price / MA50: | +1.02% | |
| Price / MA100: | +5.14% | |
| Price / MAexp7: | +3.44% | |
| Price / MAexp20: | +2.64% | |
| Price / MAexp50: | +2.48% | |
| Price / MAexp100: | +4.81% |
News
The last news published on SOPRA STERIA GROUP at the time of the generation of this analysis was as follows:
- Sopra Steria Group: 2023 Half-Year Financial Report Now Available
- Sopra Steria: First-Half 2023
- Sopra Steria Group: Disclosure of the Total Number of Shares and Voting Rights as at 30 June 2023
- Sopra Steria Integrates Generative AI Tools Into Its Development Platforms
- Sopra Steria Launches Recommended All-Cash Public Offer for Ordina Shares
About author
Online


Add a comment
Comments
0 comments on the analysis SOPRA STERIA GROUP - Daily