| Open: | - |
| Change: | - |
| Volume: | - |
| Low: | - |
| High: | - |
| High / Low range: | - |
| Type: | Stocks |
| Ticker: | SNE |
| ISIN: | JP3435000009 |
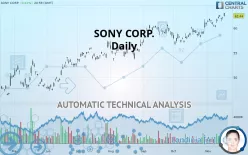
SONY CORP. - Daily - Technical analysis published on 11/19/2019 (GMT)
- 309
- 0
- 11/19/2019 - 14:42
- Who voted?
Click here for a new analysis!
- Timeframe : Daily
- - Analysis generated on 11/19/2019 - 14:42
- Status : TARGET REACHED

Summary of the analysis
Additional analysis
Quotes
SONY CORP. rating 62.44 USD. The price has increased by +0.61% since the last closing with the lowest point at 62.33 USD and the highest point at 63.01 USD. The deviation from the price is +0.18% for the low point and -0.90% for the high point.The Central Gaps scanner detects the formation of a bullish gap marking the strong presence of buyers against sellers at the opening. This formed a quotation gap.
Opening Gap UP
Type : Bullish
Timeframe : Openning
So that you have an overall view of the price change, here is a table showing the variations over several periods:
New HIGH record (5 years)
Type : Bullish
Timeframe : Weekly
New HIGH record (1 year)
Type : Bullish
Timeframe : Weekly
New HIGH record (1st january)
Type : Bullish
Timeframe : Weekly
New HIGH record (1 month)
Type : Bullish
Timeframe : Weekly
Technical
Technical analysis of this Daily chart of SONY CORP. indicates that the overall trend is strongly bullish. 92.86% of the signals given by moving averages are bullish. The overall trend is supported by the strong bullish signals from short-term moving averages. The Central Indicators scanner does not detect any result on moving averages that would impact this trend.
In fact, 13 technical indicators on 18 studied are currently bullish. But beware of excesses. The Central Indicators scanner currently detects this:
Williams %R indicator is overbought : over -20
Type : Neutral
Timeframe : Daily
Pivot points : price is over resistance 1
Type : Neutral
Timeframe : Daily
Price is back over the pivot point
Type : Bullish
Timeframe : Weekly
Central Patterns, the market scanner focusing on chart patterns, resistances and supports found this result:
Near resistance of channel
Type : Bearish
Timeframe : Daily
Central Candlesticks, the scanner specialised in Japanese candlesticks, detects a bearish signal that could support the hypothesis of a small drop in the very short term:
Downside Tasuki gap
Type : Bearish
Timeframe : Daily
| S3 | S2 | S1 | Price | |
|---|---|---|---|---|
| ProTrendLines | 51.99 | 53.70 | 60.65 | 62.44 |
| Change (%) | -16.74% | -14.00% | -2.87% | - |
| Change | -10.45 | -8.74 | -1.79 | - |
| Level | Minor | Intermediate | Major | - |
Pivot points can also be used to set your price objectives. Here is the price situation in relation to pivot points:
| Pivot points | S3 | S2 | S1 | PP | R1 | R2 | R3 |
|---|---|---|---|---|---|---|---|
| Standard | 61.31 | 61.51 | 61.79 | 61.99 | 62.27 | 62.47 | 62.75 |
| Camarilla | 61.93 | 61.97 | 62.02 | 62.06 | 62.10 | 62.15 | 62.19 |
| Woodie | 61.34 | 61.53 | 61.82 | 62.01 | 62.30 | 62.49 | 62.78 |
| Fibonacci | 61.51 | 61.70 | 61.81 | 61.99 | 62.18 | 62.29 | 62.47 |
| Pivot points | S3 | S2 | S1 | PP | R1 | R2 | R3 |
|---|---|---|---|---|---|---|---|
| Standard | 59.60 | 60.30 | 61.18 | 61.88 | 62.76 | 63.46 | 64.34 |
| Camarilla | 61.63 | 61.77 | 61.92 | 62.06 | 62.21 | 62.35 | 62.50 |
| Woodie | 59.69 | 60.35 | 61.27 | 61.93 | 62.85 | 63.51 | 64.43 |
| Fibonacci | 60.30 | 60.90 | 61.28 | 61.88 | 62.48 | 62.86 | 63.46 |
| Pivot points | S3 | S2 | S1 | PP | R1 | R2 | R3 |
|---|---|---|---|---|---|---|---|
| Standard | 52.38 | 54.44 | 57.64 | 59.70 | 62.90 | 64.96 | 68.16 |
| Camarilla | 59.38 | 59.87 | 60.35 | 60.83 | 61.31 | 61.79 | 62.28 |
| Woodie | 52.94 | 54.73 | 58.20 | 59.99 | 63.46 | 65.25 | 68.72 |
| Fibonacci | 54.44 | 56.45 | 57.69 | 59.70 | 61.71 | 62.95 | 64.96 |
Numerical data
The following is the status of technical indicators and moving averages registered at the time this technical analysis was created:
| RSI (14): | 65.55 | |
| MACD (12,26,9): | 0.8900 | |
| Directional Movement: | 20.18 | |
| AROON (14): | 100.00 | |
| DEMA (21): | 62.03 | |
| Parabolic SAR (0,02-0,02-0,2): | 61.33 | |
| Elder Ray (13): | 1.28 | |
| Super Trend (3,10): | 60.26 | |
| Zig ZAG (10): | 62.44 | |
| VORTEX (21): | 1.0900 | |
| Stochastique (14,3,5): | 83.09 | |
| TEMA (21): | 62.38 | |
| Williams %R (14): | -18.10 | |
| Chande Momentum Oscillator (20): | 1.61 | |
| Repulse (5,40,3): | -0.9100 | |
| ROCnROLL: | 1 | |
| TRIX (15,9): | 0.1900 | |
| Courbe Coppock: | 8.01 |
| MA7: | 61.84 | |
| MA20: | 60.67 | |
| MA50: | 59.61 | |
| MA100: | 57.54 | |
| MAexp7: | 61.88 | |
| MAexp20: | 60.91 | |
| MAexp50: | 59.48 | |
| MAexp100: | 57.45 | |
| Price / MA7: | +0.97% | |
| Price / MA20: | +2.92% | |
| Price / MA50: | +4.75% | |
| Price / MA100: | +8.52% | |
| Price / MAexp7: | +0.90% | |
| Price / MAexp20: | +2.51% | |
| Price / MAexp50: | +4.98% | |
| Price / MAexp100: | +8.69% |
News
The latest news and videos published on SONY CORP. at the time of the analysis were as follows:
- 11/12/2019 - 13:00 IMS Regains Control As Majority Stakeholder, Sony Pictures Television Will Retain A Minority Stake In The Company
- 11/06/2019 - 07:00 Sigma Announces New 24-70mm F2.8 DG DN Art Zoom Lens for Full Frame Mirrorless Cameras; Available in Sony E-mount and L-mount
-
10/08/2019 - 15:23
 Sony PlayStation 5 To Launch In 2020
- 09/13/2019 - 11:30 Atomos Announce 16bit RAW Support on New FX9 From Sony
-
09/12/2019 - 20:07
Sony Noise-Cancelling Headphones Are On Sale
About author

Online


Add a comment
Comments
0 comments on the analysis SONY CORP. - Daily