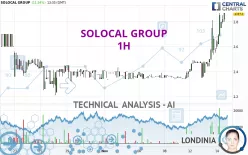
SOLOCAL GROUP - 1H - Technical analysis published on 11/14/2024 (GMT)
- 82
- 0
Click here for a new analysis!
- Timeframe : 1H
- - Analysis generated on
- Status : LEVEL MAINTAINED

Summary of the analysis

Additional analysis
Quotes
The SOLOCAL GROUP price is 2.8710 EUR. The price has increased by +11.54% since the last closing and was traded between 2.5810 EUR and 2.8710 EUR over the period. The price is currently at +11.24% from its lowest and 0% from its highest.A bullish opening was detected by the Central Gaps scanner. Buyers are trying to impose a bullish momentum in the very short term.
Bullish opening
Type : Bullish
Timeframe : Openning
So that you have an overall view of the price change, here is a table showing the variations over several periods:
New HIGH record (1 month)
Type : Bullish
Timeframe : Weekly
The Central Volumes scanner notes the presence of abnormal volumes:
Abnormal volumes
Timeframe : 5 days
Technical
Technical analysis of SOLOCAL GROUP in 1H shows a strongly overall bullish trend. 92.86% of the signals given by moving averages are bullish. The overall trend is supported by the strong bullish signals from short-term moving averages. The Central Indicators market scanner currently does not detect any result that concerns moving averages.
In fact, 16 technical indicators on 18 studied are currently positioned bullish. But beware of excesses. The Central Indicators scanner currently detects this:
CCI indicator is overbought : over 100
Type : Neutral
Timeframe : 1 hour
Williams %R indicator is overbought : over -20
Type : Neutral
Timeframe : 1 hour
Pivot points : price is over resistance 1
Type : Neutral
Timeframe : 1 hour
Pivot points : price is over resistance 3
Type : Neutral
Timeframe : Weekly
No signals are given by Central Patterns, a market scanner specialised in chart patterns, resistances and supports.
No result was found by the Central Candlesticks scanner on Japanese candlesticks.
| S3 | S2 | S1 | Price | R1 | R2 | R3 | |
|---|---|---|---|---|---|---|---|
| ProTrendLines | 2.6000 | 2.7000 | 2.7970 | 2.8710 | 40.4000 | 69.5000 | 95.3040 |
| Change (%) | -9.44% | -5.96% | -2.58% | - | +1,307.18% | +2,320.76% | +3,219.54% |
| Change | -0.2710 | -0.1710 | -0.0740 | - | +37.5290 | +66.6290 | +92.4330 |
| Level | Minor | Minor | Intermediate | - | Minor | Intermediate | Intermediate |
To determine price objectives, it is also possible to use the pivot points. Here is the price position in relation to pivot points:
| Pivot points | S3 | S2 | S1 | PP | R1 | R2 | R3 |
|---|---|---|---|---|---|---|---|
| Standard | 1.8973 | 2.1287 | 2.3513 | 2.5827 | 2.8053 | 3.0367 | 3.2593 |
| Camarilla | 2.4492 | 2.4908 | 2.5324 | 2.5740 | 2.6156 | 2.6572 | 2.6989 |
| Woodie | 1.8930 | 2.1265 | 2.3470 | 2.5805 | 2.8010 | 3.0345 | 3.2550 |
| Fibonacci | 2.1287 | 2.3021 | 2.4092 | 2.5827 | 2.7561 | 2.8632 | 3.0367 |
| Pivot points | S3 | S2 | S1 | PP | R1 | R2 | R3 |
|---|---|---|---|---|---|---|---|
| Standard | 2.2200 | 2.2800 | 2.3140 | 2.3740 | 2.4080 | 2.4680 | 2.5020 |
| Camarilla | 2.3222 | 2.3308 | 2.3394 | 2.3480 | 2.3566 | 2.3652 | 2.3739 |
| Woodie | 2.2070 | 2.2735 | 2.3010 | 2.3675 | 2.3950 | 2.4615 | 2.4890 |
| Fibonacci | 2.2800 | 2.3159 | 2.3381 | 2.3740 | 2.4099 | 2.4321 | 2.4680 |
| Pivot points | S3 | S2 | S1 | PP | R1 | R2 | R3 |
|---|---|---|---|---|---|---|---|
| Standard | 1.4207 | 1.8148 | 2.1117 | 2.5058 | 2.8027 | 3.1968 | 3.4937 |
| Camarilla | 2.2185 | 2.2818 | 2.3452 | 2.4085 | 2.4718 | 2.5352 | 2.5985 |
| Woodie | 1.3720 | 1.7905 | 2.0630 | 2.4815 | 2.7540 | 3.1725 | 3.4450 |
| Fibonacci | 1.8148 | 2.0788 | 2.2419 | 2.5058 | 2.7698 | 2.9329 | 3.1968 |
Numerical data
The following are the details of the technical indicators and moving averages that were collected to generate this technical analysis:
| RSI (14): | 69.68 | |
| MACD (12,26,9): | 0.1070 | |
| Directional Movement: | 38.4824 | |
| AROON (14): | 78.5714 | |
| DEMA (21): | 2.7554 | |
| Parabolic SAR (0,02-0,02-0,2): | 2.6167 | |
| Elder Ray (13): | 0.1483 | |
| Super Trend (3,10): | 2.5741 | |
| Zig ZAG (10): | 2.8530 | |
| VORTEX (21): | 1.0697 | |
| Stochastique (14,3,5): | 91.03 | |
| TEMA (21): | 2.8221 | |
| Williams %R (14): | -3.54 | |
| Chande Momentum Oscillator (20): | 0.3760 | |
| Repulse (5,40,3): | 6.2054 | |
| ROCnROLL: | 1 | |
| TRIX (15,9): | 0.4501 | |
| Courbe Coppock: | 24.45 |
| MA7: | 2.4635 | |
| MA20: | 2.4477 | |
| MA50: | 2.6571 | |
| MA100: | 11.9595 | |
| MAexp7: | 2.7627 | |
| MAexp20: | 2.6284 | |
| MAexp50: | 2.5119 | |
| MAexp100: | 2.4712 | |
| Price / MA7: | +16.54% | |
| Price / MA20: | +17.29% | |
| Price / MA50: | +8.05% | |
| Price / MA100: | -75.99% | |
| Price / MAexp7: | +3.92% | |
| Price / MAexp20: | +9.23% | |
| Price / MAexp50: | +14.30% | |
| Price / MAexp100: | +16.18% |
News
The last news published on SOLOCAL GROUP at the time of the generation of this analysis was as follows:
About author
Online


Add a comment
Comments
0 comments on the analysis SOLOCAL GROUP - 1H