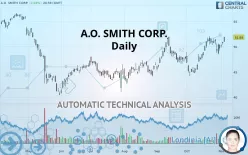
A.O. SMITH CORP. - Daily - Technical analysis published on 11/06/2019 (GMT)
- 338
- 0
- Who voted?
Click here for a new analysis!
- Timeframe : Daily
- - Analysis generated on
- Status : INVALID

Summary of the analysis

Additional analysis
Quotes
The A.O. SMITH CORP. price is 51.89 USD. The price has increased by +2.03% since the last closing with the lowest point at 50.94 USD and the highest point at 51.94 USD. The deviation from the price is +1.86% for the low point and -0.10% for the high point.A bullish gap was detected at the opening by the Central Gaps scanner. There are a lot of buyers and they have the upper hand in the very short term.
Opening Gap UP
Type : Bullish
Timeframe : Openning
So that you have an overall view of the price change, here is a table showing the variations over several periods:
Technical
Technical analysis of this Daily chart of A.O. SMITH CORP. indicates that the overall trend is strongly bullish. The signals given by the moving averages are 92.86% bullish. This strong bullish trend is confirmed by the strong signals currently being given by short-term moving averages. The Central Indicators market scanner currently does not detect any result that concerns moving averages.
Technical indicators are strongly bullish, suggesting that the price increase should continue.
Caution: the Central Indicators scanner currently detects an excess:
Williams %R indicator is overbought : over -20
Type : Neutral
Timeframe : Daily
Pivot points : price is over resistance 1
Type : Neutral
Timeframe : Weekly
Pivot points : price is over resistance 3
Type : Neutral
Timeframe : Daily
MACD crosses DOWN its Moving Average
Type : Bearish
Timeframe : Daily
Central Patterns, the market scanner focusing on chart patterns, resistances and supports found these results:
Near horizontal resistance
Type : Bearish
Timeframe : Daily
Near resistance of channel
Type : Bearish
Timeframe : Daily
Near resistance of triangle
Type : Bearish
Timeframe : Daily
For a small rebound in the very short term, the Central Candlesticks scanner currently notes the presence of this bullish pattern in Japanese candlesticks:
Bullish harami
Type : Bullish
Timeframe : Daily
| S3 | S2 | S1 | Price | R1 | R2 | R3 | |
|---|---|---|---|---|---|---|---|
| ProTrendLines | 45.00 | 47.14 | 51.41 | 51.89 | 53.34 | 55.22 | 56.49 |
| Change (%) | -13.28% | -9.15% | -0.93% | - | +2.79% | +6.42% | +8.86% |
| Change | -6.89 | -4.75 | -0.48 | - | +1.45 | +3.33 | +4.60 |
| Level | Major | Minor | Major | - | Minor | Minor | Major |
Attention could also be paid to pivot points to set price objectives:
| Pivot points | S3 | S2 | S1 | PP | R1 | R2 | R3 |
|---|---|---|---|---|---|---|---|
| Standard | 49.21 | 49.51 | 49.90 | 50.20 | 50.59 | 50.89 | 51.28 |
| Camarilla | 50.09 | 50.15 | 50.22 | 50.28 | 50.34 | 50.41 | 50.47 |
| Woodie | 49.25 | 49.53 | 49.94 | 50.22 | 50.63 | 50.91 | 51.32 |
| Fibonacci | 49.51 | 49.78 | 49.94 | 50.20 | 50.47 | 50.63 | 50.89 |
| Pivot points | S3 | S2 | S1 | PP | R1 | R2 | R3 |
|---|---|---|---|---|---|---|---|
| Standard | 45.45 | 46.84 | 48.43 | 49.83 | 51.42 | 52.81 | 54.40 |
| Camarilla | 49.20 | 49.48 | 49.75 | 50.03 | 50.30 | 50.57 | 50.85 |
| Woodie | 45.55 | 46.89 | 48.53 | 49.88 | 51.52 | 52.86 | 54.50 |
| Fibonacci | 46.84 | 47.98 | 48.69 | 49.83 | 50.97 | 51.67 | 52.81 |
| Pivot points | S3 | S2 | S1 | PP | R1 | R2 | R3 |
|---|---|---|---|---|---|---|---|
| Standard | 37.24 | 40.56 | 45.12 | 48.44 | 53.00 | 56.32 | 60.88 |
| Camarilla | 47.51 | 48.24 | 48.96 | 49.68 | 50.40 | 51.13 | 51.85 |
| Woodie | 37.86 | 40.87 | 45.74 | 48.75 | 53.62 | 56.63 | 61.50 |
| Fibonacci | 40.56 | 43.57 | 45.43 | 48.44 | 51.45 | 53.31 | 56.32 |
Numerical data
The following are the details of the technical indicators and moving averages that were collected to generate this technical analysis:
| RSI (14): | 63.56 | |
| MACD (12,26,9): | 0.9600 | |
| Directional Movement: | 13.51 | |
| AROON (14): | 100.00 | |
| DEMA (21): | 50.79 | |
| Parabolic SAR (0,02-0,02-0,2): | 48.48 | |
| Elder Ray (13): | 1.35 | |
| Super Trend (3,10): | 47.66 | |
| Zig ZAG (10): | 51.89 | |
| VORTEX (21): | 1.1400 | |
| Stochastique (14,3,5): | 73.73 | |
| TEMA (21): | 51.21 | |
| Williams %R (14): | -1.28 | |
| Chande Momentum Oscillator (20): | 2.12 | |
| Repulse (5,40,3): | 3.2300 | |
| ROCnROLL: | 1 | |
| TRIX (15,9): | 0.2700 | |
| Courbe Coppock: | 13.18 |
| MA7: | 50.44 | |
| MA20: | 49.28 | |
| MA50: | 48.02 | |
| MA100: | 46.51 | |
| MAexp7: | 50.56 | |
| MAexp20: | 49.57 | |
| MAexp50: | 48.24 | |
| MAexp100: | 47.51 | |
| Price / MA7: | +2.87% | |
| Price / MA20: | +5.30% | |
| Price / MA50: | +8.06% | |
| Price / MA100: | +11.57% | |
| Price / MAexp7: | +2.63% | |
| Price / MAexp20: | +4.68% | |
| Price / MAexp50: | +7.57% | |
| Price / MAexp100: | +9.22% |
News
The last news published on A.O. SMITH CORP. at the time of the generation of this analysis was as follows:
- A. O. Smith reports third quarter earnings of $0.53 per share
- A. O. Smith increases quarterly dividend rate to $.24 per share
- A. O. Smith to Hold Third Quarter Conference Call on October 29
- Hagens Berman Alerts A.O. Smith (AOS) Investors to New Securities Fraud Class Action, Investors Who Suffered $200,000+ Losses Should Contact the Firm
- A. O. Smith reports second quarter earnings of $0.61 per share
About author

Online


Add a comment
Comments
0 comments on the analysis A.O. SMITH CORP. - Daily