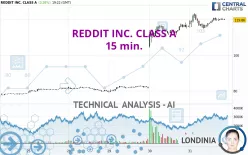
REDDIT INC. CLASS A - 15 min. - Technical analysis published on 10/31/2024 (GMT)
- 85
- 0
Click here for a new analysis!
- Timeframe : 15 min.
- - Analysis generated on
- Status : INVALID

Summary of the analysis

Additional analysis
Quotes
The REDDIT INC. CLASS A rating is 119.86 USD. The price registered an increase of +3.28% on the session and was traded between 114.80 USD and 123.60 USD over the period. The price is currently at +4.41% from its lowest and -3.03% from its highest.So that you have an overall view of the price change, here is a table showing the variations over several periods:
New HIGH record (5 years)
Type : Bullish
Timeframe : Weekly
New HIGH record (1 year)
Type : Bullish
Timeframe : Weekly
New HIGH record (1 month)
Type : Bullish
Timeframe : Weekly
Abnormal volumes on REDDIT INC. CLASS A were detected by the Central Volumes scanner:
Abnormal volumes
Timeframe : 5 days
Abnormal volumes
Timeframe : 20 days
Technical
A technical analysis in 15 min. of this REDDIT INC. CLASS A chart shows a strongly bullish trend. 92.86% of the signals given by moving averages are bullish. The overall trend is supported by the strong bullish signals from short-term moving averages. The Central Indicators market scanner is currently detecting a bearish signal that could impact this trend:
Bearish trend reversal : Moving Average 20
Type : Bearish
Timeframe : 15 minutes
The probability of a further increase are moderate given the direction of the technical indicators.
Caution: the Central Indicators scanner currently detects an excess:
Williams %R indicator is overbought : over -20
Type : Neutral
Timeframe : 15 minutes
Pivot points : price is over resistance 3
Type : Neutral
Timeframe : Weekly
Ichimoku - Bullish crossover : Tenkan & Kijun
Type : Bullish
Timeframe : 15 minutes
The analysis of the price chart with Central Patterns scanners does not return any result.
The Central Candlesticks scanner which studies Japanese candlesticks did not detect anything.
| S3 | S2 | S1 | Price | |
|---|---|---|---|---|
| ProTrendLines | 73.81 | 76.57 | 81.35 | 119.86 |
| Change (%) | -38.42% | -36.12% | -32.13% | - |
| Change | -46.05 | -43.29 | -38.51 | - |
| Level | Major | Intermediate | Intermediate | - |
To determine price objectives, it is also possible to use the pivot points. Here is the price position in relation to pivot points:
| Pivot points | S3 | S2 | S1 | PP | R1 | R2 | R3 |
|---|---|---|---|---|---|---|---|
| Standard | 93.22 | 98.66 | 107.36 | 112.80 | 121.50 | 126.94 | 135.64 |
| Camarilla | 112.16 | 113.46 | 114.75 | 116.05 | 117.35 | 118.64 | 119.94 |
| Woodie | 94.84 | 99.48 | 108.98 | 113.62 | 123.12 | 127.76 | 137.26 |
| Fibonacci | 98.66 | 104.07 | 107.40 | 112.80 | 118.21 | 121.54 | 126.94 |
| Pivot points | S3 | S2 | S1 | PP | R1 | R2 | R3 |
|---|---|---|---|---|---|---|---|
| Standard | 72.85 | 74.69 | 78.03 | 79.87 | 83.21 | 85.05 | 88.39 |
| Camarilla | 79.94 | 80.41 | 80.89 | 81.36 | 81.84 | 82.31 | 82.79 |
| Woodie | 73.59 | 75.07 | 78.77 | 80.25 | 83.95 | 85.43 | 89.13 |
| Fibonacci | 74.69 | 76.67 | 77.90 | 79.87 | 81.85 | 83.08 | 85.05 |
| Pivot points | S3 | S2 | S1 | PP | R1 | R2 | R3 |
|---|---|---|---|---|---|---|---|
| Standard | 43.88 | 49.57 | 57.74 | 63.43 | 71.60 | 77.29 | 85.46 |
| Camarilla | 62.11 | 63.38 | 64.65 | 65.92 | 67.19 | 68.46 | 69.73 |
| Woodie | 45.13 | 50.19 | 58.99 | 64.05 | 72.85 | 77.91 | 86.71 |
| Fibonacci | 49.57 | 54.86 | 58.13 | 63.43 | 68.72 | 71.99 | 77.29 |
Numerical data
The following is the status of technical indicators and moving averages registered at the time this technical analysis was created:
| RSI (14): | 63.28 | |
| MACD (12,26,9): | 1.9300 | |
| Directional Movement: | 14.18 | |
| AROON (14): | 50.00 | |
| DEMA (21): | 121.34 | |
| Parabolic SAR (0,02-0,02-0,2): | 116.07 | |
| Elder Ray (13): | 0.78 | |
| Super Trend (3,10): | 115.47 | |
| Zig ZAG (10): | 120.17 | |
| VORTEX (21): | 1.1100 | |
| Stochastique (14,3,5): | 84.78 | |
| TEMA (21): | 119.91 | |
| Williams %R (14): | -13.67 | |
| Chande Momentum Oscillator (20): | 4.30 | |
| Repulse (5,40,3): | 0.9400 | |
| ROCnROLL: | 1 | |
| TRIX (15,9): | 0.2500 | |
| Courbe Coppock: | 3.71 |
| MA7: | 90.75 | |
| MA20: | 80.18 | |
| MA50: | 69.01 | |
| MA100: | 65.58 | |
| MAexp7: | 119.97 | |
| MAexp20: | 118.45 | |
| MAexp50: | 112.21 | |
| MAexp100: | 103.07 | |
| Price / MA7: | +32.08% | |
| Price / MA20: | +49.49% | |
| Price / MA50: | +73.68% | |
| Price / MA100: | +82.77% | |
| Price / MAexp7: | -0.09% | |
| Price / MAexp20: | +1.19% | |
| Price / MAexp50: | +6.82% | |
| Price / MAexp100: | +16.29% |
About author

Online


Add a comment
Comments
0 comments on the analysis REDDIT INC. CLASS A - 15 min.