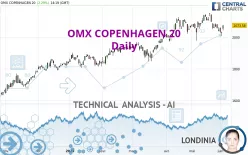
OMX COPENHAGEN 20 - Daily - Technical analysis published on 06/06/2023 (GMT)
- 159
- 0
Click here for a new analysis!
- Timeframe : Daily
- - Analysis generated on
- Status : INVALID

Summary of the analysis

Additional analysis
Quotes
OMX COPENHAGEN 20 rating 2,073.58 DKK. On the day, this instrument gained +2.29% and was between 2,043.77 DKK and 2,075.31 DKK. This implies that the price is at +1.46% from its lowest and at -0.08% from its highest.The Central Gaps scanner detects a bullish gap which is a sign that buyers have taken the lead in the very short term.
Opening Gap UP
Type : Bullish
Timeframe : Openning
A study of price movements over other periods shows the following variations:
Near a new HIGH record (5 years)
Type : Bullish
Timeframe : Weekly
Near a new HIGH record (1 year)
Type : Bullish
Timeframe : Weekly
Near a new HIGH record (1st january)
Type : Bullish
Timeframe : Weekly
Near a new HIGH record (1 month)
Type : Bullish
Timeframe : Weekly
Technical
Technical analysis of OMX COPENHAGEN 20 in Daily shows a strongly overall bullish trend. 85.71% of the signals given by moving averages are bullish. The slightly bullish signals given by the short-term moving averages indicate this trend is showing signs of running out of steam. The Central Indicators scanner detects bullish signals on moving averages that could impact this trend:
Bullish price crossover with Moving Average 50
Type : Bullish
Timeframe : Daily
Bullish price crossover with adaptative moving average 20
Type : Bullish
Timeframe : Daily
Bullish price crossover with adaptative moving average 50
Type : Bullish
Timeframe : Daily
An assessment of technical indicators does not currently provide any relevant information to suggest whether the signal given by the technical indicators is more bullish or bearish.
Other results related to technical indicators were also found by the Central Indicators scanner:
Pivot points : price is over resistance 1
Type : Neutral
Timeframe : Weekly
Pivot points : price is over resistance 3
Type : Neutral
Timeframe : Daily
RSI indicator is back over 50
Type : Bullish
Timeframe : Daily
Central Patterns, the scanner specializing in chart patterns, did not identify any signals.
The presence of a bullish Japanese candlestick pattern detected by Central Candlesticks that could cause a very short term rebound was also detected:
White morning star
Type : Bullish
Timeframe : Daily
| S3 | S2 | S1 | Price | R1 | |
|---|---|---|---|---|---|
| ProTrendLines | 1,817.96 | 1,900.17 | 2,031.77 | 2,073.58 | 2,148.56 |
| Change (%) | -12.33% | -8.36% | -2.02% | - | +3.62% |
| Change | -255.62 | -173.41 | -41.81 | - | +74.98 |
| Level | Major | Major | Major | - | Intermediate |
Attention could also be paid to pivot points to set price objectives:
| Pivot points | S3 | S2 | S1 | PP | R1 | R2 | R3 |
|---|---|---|---|---|---|---|---|
| Standard | 1,985.78 | 1,997.13 | 2,012.12 | 2,023.47 | 2,038.46 | 2,049.81 | 2,064.80 |
| Camarilla | 2,019.88 | 2,022.29 | 2,024.71 | 2,027.12 | 2,029.54 | 2,031.95 | 2,034.36 |
| Woodie | 1,987.61 | 1,998.04 | 2,013.95 | 2,024.38 | 2,040.29 | 2,050.72 | 2,066.63 |
| Fibonacci | 1,997.13 | 2,007.19 | 2,013.41 | 2,023.47 | 2,033.53 | 2,039.75 | 2,049.81 |
| Pivot points | S3 | S2 | S1 | PP | R1 | R2 | R3 |
|---|---|---|---|---|---|---|---|
| Standard | 1,922.16 | 1,965.31 | 1,996.22 | 2,039.37 | 2,070.28 | 2,113.43 | 2,144.34 |
| Camarilla | 2,006.75 | 2,013.54 | 2,020.33 | 2,027.12 | 2,033.91 | 2,040.70 | 2,047.49 |
| Woodie | 1,916.03 | 1,962.25 | 1,990.09 | 2,036.31 | 2,064.15 | 2,110.37 | 2,138.21 |
| Fibonacci | 1,965.31 | 1,993.60 | 2,011.08 | 2,039.37 | 2,067.66 | 2,085.14 | 2,113.43 |
| Pivot points | S3 | S2 | S1 | PP | R1 | R2 | R3 |
|---|---|---|---|---|---|---|---|
| Standard | 1,791.31 | 1,885.00 | 1,965.45 | 2,059.14 | 2,139.59 | 2,233.28 | 2,313.73 |
| Camarilla | 1,998.01 | 2,013.97 | 2,029.94 | 2,045.90 | 2,061.86 | 2,077.83 | 2,093.79 |
| Woodie | 1,784.69 | 1,881.69 | 1,958.83 | 2,055.83 | 2,132.97 | 2,229.97 | 2,307.11 |
| Fibonacci | 1,885.00 | 1,951.52 | 1,992.62 | 2,059.14 | 2,125.66 | 2,166.76 | 2,233.28 |
Numerical data
The following are the details of the technical indicators and moving averages that were collected to generate this technical analysis:
| RSI (14): | 51.12 | |
| MACD (12,26,9): | -0.3500 | |
| Directional Movement: | -7.60 | |
| AROON (14): | -57.15 | |
| DEMA (21): | 2,074.65 | |
| Parabolic SAR (0,02-0,02-0,2): | 2,123.71 | |
| Elder Ray (13): | -8.13 | |
| Super Trend (3,10): | 2,121.20 | |
| Zig ZAG (10): | 2,071.24 | |
| VORTEX (21): | 0.8700 | |
| Stochastique (14,3,5): | 22.03 | |
| TEMA (21): | 2,054.30 | |
| Williams %R (14): | -54.57 | |
| Chande Momentum Oscillator (20): | -56.62 | |
| Repulse (5,40,3): | 0.6900 | |
| ROCnROLL: | 1 | |
| TRIX (15,9): | 0.0700 | |
| Courbe Coppock: | 3.26 |
| MA7: | 2,054.22 | |
| MA20: | 2,081.13 | |
| MA50: | 2,043.30 | |
| MA100: | 1,968.49 | |
| MAexp7: | 2,058.63 | |
| MAexp20: | 2,069.00 | |
| MAexp50: | 2,039.57 | |
| MAexp100: | 1,976.76 | |
| Price / MA7: | +0.94% | |
| Price / MA20: | -0.36% | |
| Price / MA50: | +1.48% | |
| Price / MA100: | +5.34% | |
| Price / MAexp7: | +0.73% | |
| Price / MAexp20: | +0.22% | |
| Price / MAexp50: | +1.67% | |
| Price / MAexp100: | +4.90% |
About author
Online


Add a comment
Comments
0 comments on the analysis OMX COPENHAGEN 20 - Daily