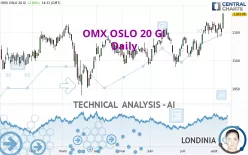
OMX OSLO 20 GI - Daily - Technical analysis published on 08/09/2023 (GMT)
- 262
- 0
Click here for a new analysis!
- Timeframe : Daily
- - Analysis generated on
- Status : INVALID

Summary of the analysis

Additional analysis
Quotes
The OMX OSLO 20 GI price is 1,183.08 NOK. The price registered an increase of +2.80% on the session and was traded between 1,156.56 NOK and 1,184.22 NOK over the period. The price is currently at +2.29% from its lowest and -0.10% from its highest.The Central Gaps scanner detects a bullish opening. A small advantage for buyers in the very short term.
Bullish opening
Type : Bullish
Timeframe : Openning
A study of price movements over other periods shows the following variations:
Near a new HIGH record (5 years)
Type : Bullish
Timeframe : Weekly
Near a new HIGH record (1 year)
Type : Bullish
Timeframe : Weekly
New HIGH record (1st january)
Type : Bullish
Timeframe : Weekly
New HIGH record (1 month)
Type : Bullish
Timeframe : Weekly
Technical
Technical analysis of this Daily chart of OMX OSLO 20 GI indicates that the overall trend is strongly bullish. 92.86% of the signals given by moving averages are bullish. This strongly bullish trend is supported by the strong bullish signals given by short-term moving averages. The Central Indicators market scanner currently does not detect any result that concerns moving averages.
Technical indicators are strongly bullish, suggesting that the price increase should continue.
But beware of excesses. The Central Indicators scanner currently detects this:
CCI indicator is overbought : over 100
Type : Neutral
Timeframe : Daily
Williams %R indicator is overbought : over -20
Type : Neutral
Timeframe : Daily
Pivot points : price is over resistance 1
Type : Neutral
Timeframe : Weekly
Pivot points : price is over resistance 3
Type : Neutral
Timeframe : Daily
MACD crosses UP its Moving Average
Type : Bullish
Timeframe : Daily
Parabolic SAR indicator bullish reversal
Type : Bullish
Timeframe : Daily
Momentum indicator is back over 0
Type : Bullish
Timeframe : Daily
Central Patterns, the scanner specializing in chart patterns, did not identify any signals.
Central Candlesticks, the scanner specialised in Japanese candlesticks, detects a bullish signal that could support the hypothesis of a small rebound in the very short term:
White morning star
Type : Bullish
Timeframe : Daily
| S3 | S2 | S1 | Price | R1 | |
|---|---|---|---|---|---|
| ProTrendLines | 1,127.63 | 1,154.41 | 1,167.91 | 1,183.08 | 1,221.83 |
| Change (%) | -4.69% | -2.42% | -1.28% | - | +3.28% |
| Change | -55.45 | -28.67 | -15.17 | - | +38.75 |
| Level | Intermediate | Major | Intermediate | - | Major |
Pivot points can also be used to set your price objectives. Here is the price situation in relation to pivot points:
| Pivot points | S3 | S2 | S1 | PP | R1 | R2 | R3 |
|---|---|---|---|---|---|---|---|
| Standard | 1,130.47 | 1,136.90 | 1,143.90 | 1,150.33 | 1,157.33 | 1,163.76 | 1,170.76 |
| Camarilla | 1,147.21 | 1,148.44 | 1,149.67 | 1,150.90 | 1,152.13 | 1,153.36 | 1,154.59 |
| Woodie | 1,130.76 | 1,137.04 | 1,144.19 | 1,150.47 | 1,157.62 | 1,163.90 | 1,171.05 |
| Fibonacci | 1,136.90 | 1,142.03 | 1,145.20 | 1,150.33 | 1,155.46 | 1,158.63 | 1,163.76 |
| Pivot points | S3 | S2 | S1 | PP | R1 | R2 | R3 |
|---|---|---|---|---|---|---|---|
| Standard | 1,118.20 | 1,129.29 | 1,147.10 | 1,158.19 | 1,176.00 | 1,187.09 | 1,204.90 |
| Camarilla | 1,156.97 | 1,159.62 | 1,162.27 | 1,164.92 | 1,167.57 | 1,170.22 | 1,172.87 |
| Woodie | 1,121.57 | 1,130.97 | 1,150.47 | 1,159.87 | 1,179.37 | 1,188.77 | 1,208.27 |
| Fibonacci | 1,129.29 | 1,140.33 | 1,147.15 | 1,158.19 | 1,169.23 | 1,176.05 | 1,187.09 |
| Pivot points | S3 | S2 | S1 | PP | R1 | R2 | R3 |
|---|---|---|---|---|---|---|---|
| Standard | 1,059.45 | 1,082.28 | 1,123.61 | 1,146.44 | 1,187.77 | 1,210.60 | 1,251.93 |
| Camarilla | 1,147.30 | 1,153.18 | 1,159.06 | 1,164.94 | 1,170.82 | 1,176.70 | 1,182.58 |
| Woodie | 1,068.70 | 1,086.91 | 1,132.86 | 1,151.07 | 1,197.02 | 1,215.23 | 1,261.18 |
| Fibonacci | 1,082.28 | 1,106.79 | 1,121.93 | 1,146.44 | 1,170.95 | 1,186.09 | 1,210.60 |
Numerical data
The following are the details of the technical indicators and moving averages that were collected to generate this technical analysis:
| RSI (14): | 63.57 | |
| MACD (12,26,9): | 9.9100 | |
| Directional Movement: | 9.16 | |
| AROON (14): | 100.00 | |
| DEMA (21): | 1,164.90 | |
| Parabolic SAR (0,02-0,02-0,2): | 1,140.37 | |
| Elder Ray (13): | 12.73 | |
| Super Trend (3,10): | 1,125.09 | |
| Zig ZAG (10): | 1,183.08 | |
| VORTEX (21): | 1.1100 | |
| Stochastique (14,3,5): | 75.93 | |
| TEMA (21): | 1,169.32 | |
| Williams %R (14): | -2.60 | |
| Chande Momentum Oscillator (20): | 21.97 | |
| Repulse (5,40,3): | 2.8600 | |
| ROCnROLL: | 1 | |
| TRIX (15,9): | 0.1200 | |
| Courbe Coppock: | 4.57 |
| MA7: | 1,161.03 | |
| MA20: | 1,150.11 | |
| MA50: | 1,135.51 | |
| MA100: | 1,121.24 | |
| MAexp7: | 1,162.89 | |
| MAexp20: | 1,152.32 | |
| MAexp50: | 1,138.93 | |
| MAexp100: | 1,130.19 | |
| Price / MA7: | +1.90% | |
| Price / MA20: | +2.87% | |
| Price / MA50: | +4.19% | |
| Price / MA100: | +5.52% | |
| Price / MAexp7: | +1.74% | |
| Price / MAexp20: | +2.67% | |
| Price / MAexp50: | +3.88% | |
| Price / MAexp100: | +4.68% |
About author
Online


Add a comment
Comments
0 comments on the analysis OMX OSLO 20 GI - Daily