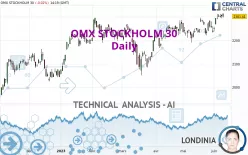
OMX STOCKHOLM 30 - Daily - Technical analysis published on 06/12/2023 (GMT)
- 159
- 0
Click here for a new analysis!
- Timeframe : Daily
- - Analysis generated on
- Status : LEVEL MAINTAINED

Summary of the analysis

Additional analysis
Quotes
The OMX STOCKHOLM 30 rating is 2,301.41 SEK. The price registered a decrease of -0.03% on the session with the lowest point at 2,295.17 SEK and the highest point at 2,315.54 SEK. The deviation from the price is +0.27% for the low point and -0.61% for the high point.The Central Gaps scanner detects a bullish gap which is a sign that buyers have taken the lead in the very short term.
Opening Gap UP
Type : Bullish
Timeframe : Openning
Here is a more detailed summary of the historical variations registered by OMX STOCKHOLM 30:
New HIGH record (1 year)
Type : Bullish
Timeframe : Weekly
New HIGH record (1st january)
Type : Bullish
Timeframe : Weekly
New HIGH record (1 month)
Type : Bullish
Timeframe : Weekly
Technical
Technical analysis of OMX STOCKHOLM 30 in Daily shows a strongly overall bullish trend. 92.86% of the signals given by moving averages are bullish. This strongly bullish trend is supported by the strong bullish signals given by short-term moving averages. The Central Indicators scanner does not detect any result on moving averages that would impact this trend.
In fact, 14 technical indicators on 18 studied are currently positioned bullish. But beware of excesses. The Central Indicators scanner currently detects this:
CCI indicator is overbought : over 100
Type : Neutral
Timeframe : Daily
Williams %R indicator is overbought : over -20
Type : Neutral
Timeframe : Daily
Price is back under the pivot point
Type : Bearish
Timeframe : Daily
Price is back under the pivot point
Type : Bearish
Timeframe : Weekly
The analysis of the price chart with Central Patterns scanners does not return any result.
The Central Candlesticks scanner which studies Japanese candlesticks did not detect anything.
| S3 | S2 | S1 | Price | R1 | |
|---|---|---|---|---|---|
| ProTrendLines | 2,087.81 | 2,221.06 | 2,291.45 | 2,301.41 | 2,456.17 |
| Change (%) | -9.28% | -3.49% | -0.43% | - | +6.72% |
| Change | -213.60 | -80.35 | -9.96 | - | +154.76 |
| Level | Major | Intermediate | Major | - | Major |
Attention could also be paid to pivot points to set price objectives:
| Pivot points | S3 | S2 | S1 | PP | R1 | R2 | R3 |
|---|---|---|---|---|---|---|---|
| Standard | 2,277.35 | 2,285.13 | 2,293.56 | 2,301.34 | 2,309.77 | 2,317.55 | 2,325.98 |
| Camarilla | 2,297.52 | 2,299.01 | 2,300.49 | 2,301.98 | 2,303.47 | 2,304.95 | 2,306.44 |
| Woodie | 2,277.67 | 2,285.29 | 2,293.88 | 2,301.50 | 2,310.09 | 2,317.71 | 2,326.30 |
| Fibonacci | 2,285.13 | 2,291.33 | 2,295.15 | 2,301.34 | 2,307.54 | 2,311.36 | 2,317.55 |
| Pivot points | S3 | S2 | S1 | PP | R1 | R2 | R3 |
|---|---|---|---|---|---|---|---|
| Standard | 2,266.90 | 2,277.85 | 2,289.91 | 2,300.86 | 2,312.92 | 2,323.87 | 2,335.93 |
| Camarilla | 2,295.65 | 2,297.76 | 2,299.87 | 2,301.98 | 2,304.09 | 2,306.20 | 2,308.31 |
| Woodie | 2,267.47 | 2,278.13 | 2,290.48 | 2,301.14 | 2,313.49 | 2,324.15 | 2,336.50 |
| Fibonacci | 2,277.85 | 2,286.64 | 2,292.07 | 2,300.86 | 2,309.65 | 2,315.08 | 2,323.87 |
| Pivot points | S3 | S2 | S1 | PP | R1 | R2 | R3 |
|---|---|---|---|---|---|---|---|
| Standard | 2,078.82 | 2,134.27 | 2,184.62 | 2,240.07 | 2,290.42 | 2,345.87 | 2,396.22 |
| Camarilla | 2,205.87 | 2,215.56 | 2,225.26 | 2,234.96 | 2,244.66 | 2,254.36 | 2,264.06 |
| Woodie | 2,076.26 | 2,133.00 | 2,182.06 | 2,238.80 | 2,287.86 | 2,344.60 | 2,393.66 |
| Fibonacci | 2,134.27 | 2,174.69 | 2,199.66 | 2,240.07 | 2,280.49 | 2,305.46 | 2,345.87 |
Numerical data
The following is the status of the technical indicators and moving averages at the time of publication of this technical analysis:
| RSI (14): | 60.00 | |
| MACD (12,26,9): | 17.1500 | |
| Directional Movement: | 9.31 | |
| AROON (14): | 78.57 | |
| DEMA (21): | 2,292.03 | |
| Parabolic SAR (0,02-0,02-0,2): | 2,231.26 | |
| Elder Ray (13): | 25.24 | |
| Super Trend (3,10): | 2,230.60 | |
| Zig ZAG (10): | 2,299.84 | |
| VORTEX (21): | 1.0800 | |
| Stochastique (14,3,5): | 87.92 | |
| TEMA (21): | 2,298.79 | |
| Williams %R (14): | -15.95 | |
| Chande Momentum Oscillator (20): | 70.64 | |
| Repulse (5,40,3): | -0.5300 | |
| ROCnROLL: | 1 | |
| TRIX (15,9): | 0.0800 | |
| Courbe Coppock: | 3.35 |
| MA7: | 2,292.66 | |
| MA20: | 2,266.99 | |
| MA50: | 2,242.00 | |
| MA100: | 2,224.01 | |
| MAexp7: | 2,291.66 | |
| MAexp20: | 2,270.91 | |
| MAexp50: | 2,245.31 | |
| MAexp100: | 2,209.65 | |
| Price / MA7: | +0.38% | |
| Price / MA20: | +1.52% | |
| Price / MA50: | +2.65% | |
| Price / MA100: | +3.48% | |
| Price / MAexp7: | +0.43% | |
| Price / MAexp20: | +1.34% | |
| Price / MAexp50: | +2.50% | |
| Price / MAexp100: | +4.15% |
About author
Online


Add a comment
Comments
0 comments on the analysis OMX STOCKHOLM 30 - Daily