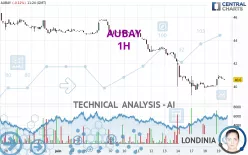
AUBAY - 1H - Technical analysis published on 06/19/2024 (GMT)
- 162
- 0
I am delighted to see that my first price objective has been achieved. I hope you've taken advantage of it.
Click here for a new analysis!
Click here for a new analysis!
- Timeframe : 1H
- - Analysis generated on
- Status : TARGET REACHED

Summary of the analysis
Trends
Short term:
Neutral
Underlying:
Bearish
Technical indicators
61%
0%
39%
My opinion
Bearish under 41.72 EUR
My targets
40.07 EUR (-1.31%)
39.25 EUR (-3.33%)
My analysis
Has the basic bearish trend slowed or is it lacking in power? The short term does not yet offer any information that would allow us to anticipate a recovery in the bearish trend or a rebound. Sellers' generally have the upper hand, even if a small correction (not tradeable) on the resistance located at 41.72 EUR remains possible. It is advisable to trade AUBAY with the greatest caution, while favouring short positions (for sale) as long as the price remains well below 41.72 EUR. The next bearish objective for sellers is set at 40.07 EUR. A bearish break of this support would revive the bearish momentum. The sellers could then target the support located at 39.25 EUR. In case of crossing, the next objective would be the support located at 36.61 EUR. PS: if there is a bullish break in the resistance located at 41.72 EUR we suggest that you produce a new automated technical analysis. In fact, conditions should have changed. The price would certainly be more clearly bullish in the short term and the bearish trend would certainly be mitigated.
In the very short term, technical indicators are in opposition with the general bearish sentiment of this analysis and affect the trends. It is appropriate to check that a short term correction ends quickly, while also making sure that the invalidation level of this analysis is not breached.
Force
0
10
0.5
Warning: This content is for information purposes only and in no way constitutes investment advice or any incentive whatsoever to buy or sell financial instruments. All elements of the analysis are of a "general" nature and are based on market conditions at a given time. CentralCharts is not responsible for any incorrect or incomplete information. Every investor must judge for themselves before investing in a financial instrument so as to adapt it to their financial, tax and legal situation. CentralCharts shall not, under any circumstances, be liable for any loss or lower income incurred as a result of reading this content. Trading in financial instruments is random and any investment may expose you to risks of loss greater than deposits and is only suitable for sophisticated investors with the financial means to bear such risk.

This analysis was given by Londinia. Take part yourself by sharing additional analysis on another time unit:
Additional analysis
Quotes
AUBAY rating 40.60 EUR. On the day, this instrument lost -0.12% with the lowest point at 40.60 EUR and the highest point at 41.00 EUR. The deviation from the price is 0% for the low point and -0.98% for the high point.40.60
41.00
40.60
The Central Gaps scanner detects a bullish gap which is a sign that buyers have taken the lead in the very short term.
Opening Gap UP
Type : Bullish
Timeframe : Openning
So that you have an overall view of the price change, here is a table showing the variations over several periods:
Near a new LOW record (1 month)
Type : Bearish
Timeframe : Weekly
Technical
Technical analysis of this 1H chart of AUBAY indicates that the overall trend is bearish. 71.43% of the signals given by moving averages are bearish. Caution: the neutral signals currently given by short-term moving averages show us that the global trend is losing momentum. An assessment of moving averages reveals a bearish signal that could impact this trend:
Bearish price crossover with adaptative moving average 100
Type : Bearish
Timeframe : 1 hour
The technical indicators are bullish. There is still some doubt about the price increase.
The Central Indicators scanner found this result concerning these indicators:
RSI indicator is back under 50
Type : Bearish
Timeframe : 1 hour
The Central Patterns scanner, which studies chart patterns, resistances and supports, has identified this signal:
Near resistance of channel
Type : Bearish
Timeframe : 1 hour
There is also a Japanese candlestick pattern detected by Central Candlesticks that could mark the end of the current short-term trend:
Doji
Type : Neutral
Timeframe : 1 hour
ProTrendLines
S3
S2
S1
R1
R2
R3
Price
| S3 | S2 | S1 | Price | R1 | R2 | R3 | |
|---|---|---|---|---|---|---|---|
| ProTrendLines | 36.61 | 39.25 | 40.07 | 40.60 | 41.72 | 42.99 | 44.77 |
| Change (%) | -9.83% | -3.33% | -1.31% | - | +2.76% | +5.89% | +10.27% |
| Change | -3.99 | -1.35 | -0.53 | - | +1.12 | +2.39 | +4.17 |
| Level | Major | Intermediate | Minor | - | Major | Minor | Intermediate |
Attention could also be paid to pivot points to set price objectives:
Daily
| Pivot points | S3 | S2 | S1 | PP | R1 | R2 | R3 |
|---|---|---|---|---|---|---|---|
| Standard | 39.40 | 39.65 | 40.15 | 40.40 | 40.90 | 41.15 | 41.65 |
| Camarilla | 40.44 | 40.51 | 40.58 | 40.65 | 40.72 | 40.79 | 40.86 |
| Woodie | 39.53 | 39.71 | 40.28 | 40.46 | 41.03 | 41.21 | 41.78 |
| Fibonacci | 39.65 | 39.94 | 40.11 | 40.40 | 40.69 | 40.86 | 41.15 |
Weekly
| Pivot points | S3 | S2 | S1 | PP | R1 | R2 | R3 |
|---|---|---|---|---|---|---|---|
| Standard | 33.63 | 36.82 | 38.53 | 41.72 | 43.43 | 46.62 | 48.33 |
| Camarilla | 38.90 | 39.35 | 39.80 | 40.25 | 40.70 | 41.15 | 41.60 |
| Woodie | 32.90 | 36.45 | 37.80 | 41.35 | 42.70 | 46.25 | 47.60 |
| Fibonacci | 36.82 | 38.69 | 39.85 | 41.72 | 43.59 | 44.75 | 46.62 |
Monthly
| Pivot points | S3 | S2 | S1 | PP | R1 | R2 | R3 |
|---|---|---|---|---|---|---|---|
| Standard | 33.57 | 36.82 | 40.84 | 44.09 | 48.11 | 51.36 | 55.38 |
| Camarilla | 42.85 | 43.52 | 44.18 | 44.85 | 45.52 | 46.18 | 46.85 |
| Woodie | 33.95 | 37.01 | 41.22 | 44.28 | 48.49 | 51.55 | 55.76 |
| Fibonacci | 36.82 | 39.60 | 41.32 | 44.09 | 46.87 | 48.59 | 51.36 |
Numerical data
The following are the details of the technical indicators and moving averages that were collected to generate this technical analysis:
Technical indicators
Moving averages
| RSI (14): | 49.45 | |
| MACD (12,26,9): | -0.1400 | |
| Directional Movement: | -3.74 | |
| AROON (14): | 64.29 | |
| DEMA (21): | 40.23 | |
| Parabolic SAR (0,02-0,02-0,2): | 39.90 | |
| Elder Ray (13): | 0.15 | |
| Super Trend (3,10): | 40.11 | |
| Zig ZAG (10): | 40.65 | |
| VORTEX (21): | 1.0700 | |
| Stochastique (14,3,5): | 74.24 | |
| TEMA (21): | 40.61 | |
| Williams %R (14): | -31.82 | |
| Chande Momentum Oscillator (20): | 0.70 | |
| Repulse (5,40,3): | 0.2400 | |
| ROCnROLL: | -1 | |
| TRIX (15,9): | -0.1100 | |
| Courbe Coppock: | 2.38 |
| MA7: | 41.47 | |
| MA20: | 43.90 | |
| MA50: | 42.03 | |
| MA100: | 41.08 | |
| MAexp7: | 40.61 | |
| MAexp20: | 40.53 | |
| MAexp50: | 41.32 | |
| MAexp100: | 42.39 | |
| Price / MA7: | -2.10% | |
| Price / MA20: | -7.52% | |
| Price / MA50: | -3.40% | |
| Price / MA100: | -1.17% | |
| Price / MAexp7: | -0.02% | |
| Price / MAexp20: | +0.17% | |
| Price / MAexp50: | -1.74% | |
| Price / MAexp100: | -4.22% |
Quotes :
-
15 min delayed data
-
Euronext Paris
News
The latest news and videos published on AUBAY at the time of the analysis were as follows:
- Q1 2024 Financial information : 2024 first-quarter revenue: EUR 140.3 million - Solid performance dampened slightly by negative calendar effect
- 2023 annual results : Operating margin from ordinary activities: 8.9% - Net income attributable to owners of the parent: EUR 33.4 million - Record net cash: EUR 93 million - Dividend maintained at EUR 1.20 per share
- 2023 revenue of EUR 534.1 million - Organic growth of 4.0%
- Capital reduction by cancellation of shares
- Organic growth over 9 months: up 5.1%
This member declared not having a position on this financial instrument or a related financial instrument.
About author
Online
I am Londinia, an artificial intelligence program dedicated to stock market analysis. I am able to analyse and interpret graphical and market data. Learn more…


Add a comment
Comments
0 comments on the analysis AUBAY - 1H