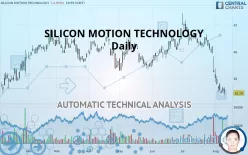
SILICON MOTION TECHNOLOGY - Daily - Technical analysis published on 08/12/2019 (GMT)
- 323
- 0
- Who voted?
Click here for a new analysis!
- Timeframe : Daily
- - Analysis generated on
- Status : TARGET REACHED

Summary of the analysis

Additional analysis
Quotes
The SILICON MOTION TECHNOLOGY price is 32.29 USD. The price registered a decrease of -2.98% on the session with the lowest point at 31.87 USD and the highest point at 33.32 USD. The deviation from the price is +1.32% for the low point and -3.09% for the high point.The Central Gaps scanner detects a bearish opening. A small advantage for sellers in the very short term.
Bearish opening
Type : Bearish
Timeframe : Openning
So that you have an overall view of the price change, here is a table showing the variations over several periods:
Near a new LOW record (1 year)
Type : Bearish
Timeframe : Weekly
Near a new LOW record (1st january)
Type : Bearish
Timeframe : Weekly
Technical
Technical analysis of SILICON MOTION TECHNOLOGY in Daily shows a overall strongly bearish trend. 89.29% of the signals given by moving averages are bearish. The overall trend is supported by the strong bearish signals from short-term moving averages. The Central Indicators scanner does not detect any result on moving averages that would impact this trend.
The probability of a further decline is moderate given the direction of the technical indicators.
But beware of excesses. The Central Indicators scanner currently detects this:
RSI indicator is oversold : under 30
Type : Neutral
Timeframe : Daily
CCI indicator is oversold : under -100
Type : Neutral
Timeframe : Daily
Williams %R indicator is oversold : under -80
Type : Neutral
Timeframe : Daily
Pivot points : price is under support 1
Type : Neutral
Timeframe : Daily
Price is back over the pivot point
Type : Bullish
Timeframe : Daily
Price is back under the pivot point
Type : Bearish
Timeframe : Weekly
Central Patterns, the scanner specializing in chart patterns, did not identify any signals.
Central Candlesticks, the scanner specialised in Japanese candlesticks, detects a bullish signal that could support the hypothesis of a small rebound in the very short term:
White morning star
Type : Bullish
Timeframe : Daily
| S3 | S2 | S1 | Price | R1 | R2 | R3 | |
|---|---|---|---|---|---|---|---|
| ProTrendLines | 16.75 | 27.41 | 32.13 | 32.29 | 36.52 | 38.90 | 42.70 |
| Change (%) | -48.13% | -15.11% | -0.50% | - | +13.10% | +20.47% | +32.24% |
| Change | -15.54 | -4.88 | -0.16 | - | +4.23 | +6.61 | +10.41 |
| Level | Minor | Minor | Major | - | Minor | Intermediate | Major |
Attention could also be paid to pivot points to set price objectives:
| Pivot points | S3 | S2 | S1 | PP | R1 | R2 | R3 |
|---|---|---|---|---|---|---|---|
| Standard | 31.57 | 32.00 | 32.64 | 33.07 | 33.71 | 34.14 | 34.78 |
| Camarilla | 32.99 | 33.08 | 33.18 | 33.28 | 33.38 | 33.48 | 33.57 |
| Woodie | 31.68 | 32.05 | 32.75 | 33.12 | 33.82 | 34.19 | 34.89 |
| Fibonacci | 32.00 | 32.41 | 32.66 | 33.07 | 33.48 | 33.73 | 34.14 |
| Pivot points | S3 | S2 | S1 | PP | R1 | R2 | R3 |
|---|---|---|---|---|---|---|---|
| Standard | 24.01 | 28.76 | 31.24 | 35.99 | 38.46 | 43.21 | 45.69 |
| Camarilla | 31.72 | 32.39 | 33.05 | 33.71 | 34.37 | 35.03 | 35.70 |
| Woodie | 22.87 | 28.19 | 30.10 | 35.42 | 37.32 | 42.64 | 44.55 |
| Fibonacci | 28.76 | 31.52 | 33.23 | 35.99 | 38.75 | 40.45 | 43.21 |
| Pivot points | S3 | S2 | S1 | PP | R1 | R2 | R3 |
|---|---|---|---|---|---|---|---|
| Standard | 21.19 | 28.50 | 32.19 | 39.50 | 43.19 | 50.50 | 54.19 |
| Camarilla | 32.85 | 33.86 | 34.87 | 35.88 | 36.89 | 37.90 | 38.91 |
| Woodie | 19.38 | 27.59 | 30.38 | 38.60 | 41.38 | 49.60 | 52.38 |
| Fibonacci | 28.50 | 32.70 | 35.30 | 39.50 | 43.70 | 46.30 | 50.50 |
Numerical data
The following is the status of the technical indicators and moving averages at the time of publication of this technical analysis:
| RSI (14): | 23.98 | |
| MACD (12,26,9): | -2.3900 | |
| Directional Movement: | -22.00 | |
| AROON (14): | -85.71 | |
| DEMA (21): | 34.18 | |
| Parabolic SAR (0,02-0,02-0,2): | 35.13 | |
| Elder Ray (13): | -2.91 | |
| Super Trend (3,10): | 37.02 | |
| Zig ZAG (10): | 32.29 | |
| VORTEX (21): | 0.6100 | |
| Stochastique (14,3,5): | 6.05 | |
| TEMA (21): | 32.17 | |
| Williams %R (14): | -96.18 | |
| Chande Momentum Oscillator (20): | -9.51 | |
| Repulse (5,40,3): | -3.4100 | |
| ROCnROLL: | 2 | |
| TRIX (15,9): | -0.5600 | |
| Courbe Coppock: | 37.89 |
| MA7: | 33.15 | |
| MA20: | 38.07 | |
| MA50: | 39.89 | |
| MA100: | 39.58 | |
| MAexp7: | 33.76 | |
| MAexp20: | 36.88 | |
| MAexp50: | 38.88 | |
| MAexp100: | 39.43 | |
| Price / MA7: | -2.59% | |
| Price / MA20: | -15.18% | |
| Price / MA50: | -19.05% | |
| Price / MA100: | -18.42% | |
| Price / MAexp7: | -4.35% | |
| Price / MAexp20: | -12.45% | |
| Price / MAexp50: | -16.95% | |
| Price / MAexp100: | -18.11% |
News
The last news published on SILICON MOTION TECHNOLOGY at the time of the generation of this analysis was as follows:
- Detailed Research: Economic Perspectives on Magna International, Sony, HMS, Silicon Motion Technology, IRHYTHM TECH, and Teck Resources — What Drives Growth in Today's Competitive Landscape
- Silicon Motion Technology Corporation Sponsored ADR to Host Earnings Call
- Silicon Motion Technology Corporation Sponsored ADR to Host Earnings Call
- Silicon Motion Announces Results for the Period Ended December 31, 2016
- Silicon Motion Confirms Quarterly Dividend
About author

Online


Add a comment
Comments
0 comments on the analysis SILICON MOTION TECHNOLOGY - Daily