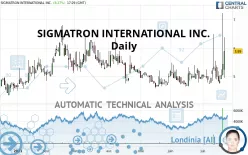
SIGMATRON INTERNATIONAL INC. - Daily - Technical analysis published on 07/22/2021 (GMT)
- 164
- 0
Click here for a new analysis!
- Timeframe : Daily
- - Analysis generated on
- Status : TARGET REACHED

Summary of the analysis

Additional analysis
Quotes
The SIGMATRON INTERNATIONAL INC. price is 5.89 USD. On the day, this instrument gained +8.27% and was between 4.95 USD and 6.38 USD. This implies that the price is at +18.99% from its lowest and at -7.68% from its highest.The Central Gaps scanner detects a bearish opening marking the presence of sellers ahead of buyers at the opening but not sufficiently marked to allow the price to register a quotation gap.
Bearish opening
Type : Bearish
Timeframe : Openning
Here is a more detailed summary of the historical variations registered by SIGMATRON INTERNATIONAL INC.:
Near a new LOW record (1 month)
Type : Bearish
Timeframe : Weekly
The Central Volumes scanner notes the presence of abnormal volumes:
Abnormal volumes
Timeframe : 5 days
Abnormal volumes
Timeframe : 20 days
Abnormal volumes
Timeframe : 50 days
Technical
A technical analysis in Daily of this SIGMATRON INTERNATIONAL INC. chart shows a strongly bullish trend. 85.71% of the signals given by moving averages are bullish. This strongly bullish trend is supported by the strong bullish signals given by short-term moving averages. An assessment of moving averages reveals several bullish signals that could impact this trend:
Bullish trend reversal : Moving Average 50
Type : Bullish
Timeframe : Daily
Bullish price crossover with adaptative moving average 100
Type : Bullish
Timeframe : Daily
The probability of a further increase is high given the direction of the technical indicators.
Caution: the Central Indicators scanner currently detects an excess:
CCI indicator is overbought : over 100
Type : Neutral
Timeframe : Daily
MACD crosses UP its Moving Average
Type : Bullish
Timeframe : Daily
Parabolic SAR indicator bullish reversal
Type : Bullish
Timeframe : Daily
Aroon indicator bullish trend
Type : Bullish
Timeframe : Daily
No signals are given by Central Patterns, a market scanner specialised in chart patterns, resistances and supports.
The Central Candlesticks scanner which studies Japanese candlesticks did not detect anything.
| S3 | S2 | S1 | Price | R1 | R2 | R3 | |
|---|---|---|---|---|---|---|---|
| ProTrendLines | 4.75 | 5.13 | 5.75 | 5.89 | 6.41 | 7.84 | 8.84 |
| Change (%) | -19.35% | -12.90% | -2.38% | - | +8.83% | +33.11% | +50.08% |
| Change | -1.14 | -0.76 | -0.14 | - | +0.52 | +1.95 | +2.95 |
| Level | Intermediate | Major | Minor | - | Major | Minor | Minor |
To determine price objectives, it is also possible to use the pivot points. Here is the price position in relation to pivot points:
| Pivot points | S3 | S2 | S1 | PP | R1 | R2 | R3 |
|---|---|---|---|---|---|---|---|
| Standard | 2.37 | 3.70 | 4.57 | 5.90 | 6.77 | 8.10 | 8.97 |
| Camarilla | 4.84 | 5.04 | 5.24 | 5.44 | 5.64 | 5.84 | 6.05 |
| Woodie | 2.14 | 3.59 | 4.34 | 5.79 | 6.54 | 7.99 | 8.74 |
| Fibonacci | 3.70 | 4.54 | 5.06 | 5.90 | 6.74 | 7.26 | 8.10 |
| Pivot points | S3 | S2 | S1 | PP | R1 | R2 | R3 |
|---|---|---|---|---|---|---|---|
| Standard | 2.60 | 3.71 | 4.27 | 5.38 | 5.94 | 7.05 | 7.61 |
| Camarilla | 4.37 | 4.52 | 4.68 | 4.83 | 4.98 | 5.14 | 5.29 |
| Woodie | 2.33 | 3.57 | 4.00 | 5.24 | 5.67 | 6.91 | 7.34 |
| Fibonacci | 3.71 | 4.35 | 4.74 | 5.38 | 6.02 | 6.41 | 7.05 |
| Pivot points | S3 | S2 | S1 | PP | R1 | R2 | R3 |
|---|---|---|---|---|---|---|---|
| Standard | 3.79 | 4.21 | 4.64 | 5.06 | 5.49 | 5.91 | 6.34 |
| Camarilla | 4.83 | 4.90 | 4.98 | 5.06 | 5.14 | 5.22 | 5.29 |
| Woodie | 3.79 | 4.21 | 4.64 | 5.06 | 5.49 | 5.91 | 6.34 |
| Fibonacci | 4.21 | 4.54 | 4.74 | 5.06 | 5.39 | 5.59 | 5.91 |
Numerical data
The following is the status of the technical indicators and moving averages at the time of publication of this technical analysis:
| RSI (14): | 72.10 | |
| MACD (12,26,9): | 0.1200 | |
| Directional Movement: | 35.57 | |
| AROON (14): | 14.29 | |
| DEMA (21): | 5.26 | |
| Parabolic SAR (0,02-0,02-0,2): | 4.79 | |
| Elder Ray (13): | 0.46 | |
| Super Trend (3,10): | 4.83 | |
| Zig ZAG (10): | 5.84 | |
| VORTEX (21): | 0.9900 | |
| Stochastique (14,3,5): | 31.03 | |
| TEMA (21): | 5.34 | |
| Williams %R (14): | -52.41 | |
| Chande Momentum Oscillator (20): | 1.01 | |
| Repulse (5,40,3): | 6.6200 | |
| ROCnROLL: | 1 | |
| TRIX (15,9): | 0.1300 | |
| Courbe Coppock: | 11.12 |
| MA7: | 5.18 | |
| MA20: | 5.08 | |
| MA50: | 4.95 | |
| MA100: | 5.19 | |
| MAexp7: | 5.29 | |
| MAexp20: | 5.11 | |
| MAexp50: | 5.06 | |
| MAexp100: | 5.04 | |
| Price / MA7: | +13.71% | |
| Price / MA20: | +15.94% | |
| Price / MA50: | +18.99% | |
| Price / MA100: | +13.49% | |
| Price / MAexp7: | +11.34% | |
| Price / MAexp20: | +15.26% | |
| Price / MAexp50: | +16.40% | |
| Price / MAexp100: | +16.87% |
News
Don't forget to follow the news on SIGMATRON INTERNATIONAL INC.. At the time of publication of this analysis, the latest news was as follows:
 SigmaTron
About author

Online


Add a comment
Comments
0 comments on the analysis SIGMATRON INTERNATIONAL INC. - Daily