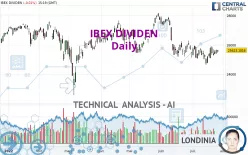
IBEX DIVIDEN - Daily - Technical analysis published on 07/26/2022 (GMT)
- 190
- 0
Click here for a new analysis!
- Timeframe : Daily
- - Analysis generated on
- Status : INVALID

Summary of the analysis

Additional analysis
Quotes
The IBEX DIVIDEN price is 25,624.9004 EUR. The price registered an increase of +0.00% on the session with the lowest point at 25,460.5000 EUR and the highest point at 25,661.8008 EUR. The deviation from the price is +0.65% for the low point and -0.14% for the high point.The Central Gaps scanner detects a bearish opening. A small advantage for sellers in the very short term.
Bearish opening
Type : Bearish
Timeframe : Openning
A study of price movements over other periods shows the following variations:
Near a new LOW record (1 month)
Type : Bearish
Timeframe : Weekly
Technical
Technical analysis of this Daily chart of IBEX DIVIDEN indicates that the overall trend is bearish. 64.29% of the signals given by moving averages are bearish. Caution: the neutral signals currently given by short-term moving averages show us that the global trend is losing momentum. The Central Indicators market scanner is currently detecting several bearish and bullish signals that could impact this trend:
Bullish trend reversal : adaptative moving average 20
Type : Bullish
Timeframe : Daily
Moving Average bearish crossovers : MA50 & MA100
Type : Bearish
Timeframe : Daily
The probability of a further increase are moderate given the direction of the technical indicators.
Caution: the Central Indicators scanner currently detects an excess:
Williams %R indicator is overbought : over -20
Type : Neutral
Timeframe : Daily
RSI indicator is back over 50
Type : Bullish
Timeframe : Daily
Aroon indicator bullish trend
Type : Bullish
Timeframe : Daily
Price is back over the pivot point
Type : Bullish
Timeframe : Daily
Price is back over the pivot point
Type : Bullish
Timeframe : Weekly
No signals are given by Central Patterns, a market scanner specialised in chart patterns, resistances and supports.
The Central Candlesticks scanner which studies Japanese candlesticks did not detect anything.
| S3 | S2 | S1 | Price | R1 | R2 | R3 | |
|---|---|---|---|---|---|---|---|
| ProTrendLines | 23,362.3000 | 24,734.2000 | 25,378.7000 | 25,624.9004 | 26,091.4000 | 27,143.2000 | 27,494.6000 |
| Change (%) | -8.83% | -3.48% | -0.96% | - | +1.82% | +5.93% | +7.30% |
| Change | -2,262.6004 | -890.7004 | -246.2004 | - | +466.4996 | +1,518.2996 | +1,869.6996 |
| Level | Intermediate | Intermediate | Major | - | Major | Major | Major |
Pivot points can also be used to set your price objectives. Here is the price situation in relation to pivot points:
| Pivot points | S3 | S2 | S1 | PP | R1 | R2 | R3 |
|---|---|---|---|---|---|---|---|
| Standard | 25,181.1992 | 25,292.5996 | 25,459.0996 | 25,570.5000 | 25,737.0000 | 25,848.4004 | 26,014.9004 |
| Camarilla | 25,549.1770 | 25,574.6512 | 25,600.1254 | 25,625.5996 | 25,651.0738 | 25,676.5480 | 25,702.0222 |
| Woodie | 25,208.7490 | 25,306.3745 | 25,486.6494 | 25,584.2749 | 25,764.5498 | 25,862.1753 | 26,042.4502 |
| Fibonacci | 25,292.5996 | 25,398.7576 | 25,464.3421 | 25,570.5000 | 25,676.6580 | 25,742.2425 | 25,848.4004 |
| Pivot points | S3 | S2 | S1 | PP | R1 | R2 | R3 |
|---|---|---|---|---|---|---|---|
| Standard | 24,269.6660 | 24,673.6328 | 25,095.6660 | 25,499.6328 | 25,921.6660 | 26,325.6328 | 26,747.6660 |
| Camarilla | 25,290.5492 | 25,366.2659 | 25,441.9825 | 25,517.6992 | 25,593.4159 | 25,669.1325 | 25,744.8492 |
| Woodie | 24,278.6992 | 24,678.1494 | 25,104.6992 | 25,504.1494 | 25,930.6992 | 26,330.1494 | 26,756.6992 |
| Fibonacci | 24,673.6328 | 24,989.1648 | 25,184.1008 | 25,499.6328 | 25,815.1648 | 26,010.1008 | 26,325.6328 |
| Pivot points | S3 | S2 | S1 | PP | R1 | R2 | R3 |
|---|---|---|---|---|---|---|---|
| Standard | 21,589.7656 | 23,361.7324 | 24,412.0664 | 26,184.0332 | 27,234.3672 | 29,006.3340 | 30,056.6680 |
| Camarilla | 24,686.2677 | 24,944.9786 | 25,203.6895 | 25,462.4004 | 25,721.1113 | 25,979.8222 | 26,238.5331 |
| Woodie | 21,228.9492 | 23,181.3242 | 24,051.2500 | 26,003.6250 | 26,873.5508 | 28,825.9258 | 29,695.8516 |
| Fibonacci | 23,361.7324 | 24,439.8513 | 25,105.9143 | 26,184.0332 | 27,262.1521 | 27,928.2151 | 29,006.3340 |
Numerical data
The following are the details of the technical indicators and moving averages that were collected to generate this technical analysis:
| RSI (14): | 49.77 | |
| MACD (12,26,9): | -135.5573 | |
| Directional Movement: | -2.3229 | |
| AROON (14): | 28.5715 | |
| DEMA (21): | 25,315.2983 | |
| Parabolic SAR (0,02-0,02-0,2): | 24,825.4578 | |
| Elder Ray (13): | 76.2050 | |
| Super Trend (3,10): | 26,302.2181 | |
| Zig ZAG (10): | 25,611.9004 | |
| VORTEX (21): | 0.9280 | |
| Stochastique (14,3,5): | 75.56 | |
| TEMA (21): | 25,398.7182 | |
| Williams %R (14): | -21.85 | |
| Chande Momentum Oscillator (20): | -50.5996 | |
| Repulse (5,40,3): | 1.3297 | |
| ROCnROLL: | -1 | |
| TRIX (15,9): | -0.1298 | |
| Courbe Coppock: | 0.27 |
| MA7: | 25,513.4573 | |
| MA20: | 25,440.2801 | |
| MA50: | 26,172.1100 | |
| MA100: | 26,174.7429 | |
| MAexp7: | 25,509.3220 | |
| MAexp20: | 25,543.5766 | |
| MAexp50: | 25,874.6633 | |
| MAexp100: | 26,138.6621 | |
| Price / MA7: | +0.44% | |
| Price / MA20: | +0.73% | |
| Price / MA50: | -2.09% | |
| Price / MA100: | -2.10% | |
| Price / MAexp7: | +0.45% | |
| Price / MAexp20: | +0.32% | |
| Price / MAexp50: | -0.97% | |
| Price / MAexp100: | -1.97% |
About author
Online


Add a comment
Comments
0 comments on the analysis IBEX DIVIDEN - Daily