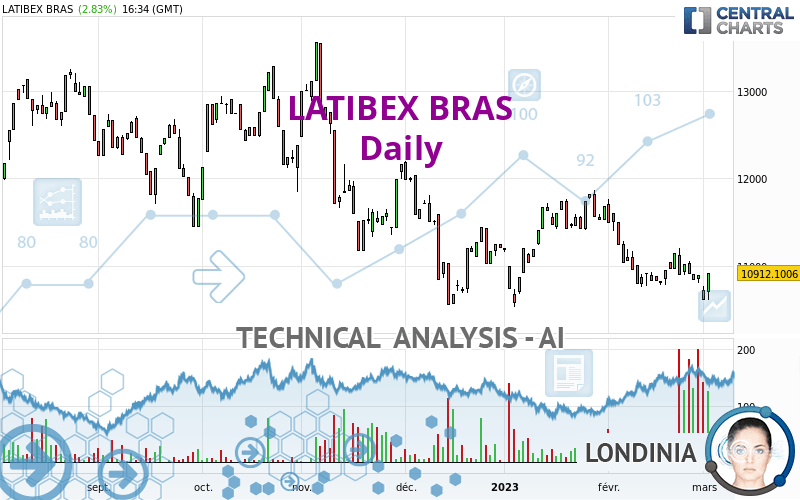
LATIBEX BRAS - Daily - Technical analysis published on 03/02/2023 (GMT)
- 136
- 0
Click here for a new analysis!
- Timeframe : Daily
- - Analysis generated on
- Status : TARGET REACHED

Summary of the analysis

Additional analysis
Quotes
LATIBEX BRAS rating 10,912.0996 EUR. The price registered an increase of +2.83% on the session and was between 10,609.5996 EUR and 10,912.0996 EUR. This implies that the price is at +2.85% from its lowest and at 0% from its highest.A bullish opening was detected by the Central Gaps scanner. Buyers are trying to impose a bullish momentum in the very short term.
Bullish opening
Type : Bullish
Timeframe : Openning
So that you have an overall view of the price change, here is a table showing the variations over several periods:
Near a new LOW record (1 year)
Type : Bearish
Timeframe : Weekly
Near a new LOW record (1st january)
Type : Bearish
Timeframe : Weekly
New LOW record (1 month)
Type : Bearish
Timeframe : Weekly
The Central Volumes scanner detects abnormal volumes on the asset:
Abnormal volumes
Timeframe : 5 days
Abnormal volumes
Timeframe : 20 days
Technical
Technical analysis of LATIBEX BRAS in Daily shows a overall strongly bearish trend. 92.86% of the signals given by moving averages are bearish. The overall trend is supported by the strong bearish signals from short-term moving averages. An assessment of moving averages reveals a bearish signal that could impact this trend:
Bearish trend reversal : Moving Average 50
Type : Bearish
Timeframe : Daily
On the 18 technical indicators analysed, 9 are bullish, 5 are neutral and 4 are bearish. Caution: the Central Indicators scanner currently detects an excess:
Previous candle closed under Bollinger bands
Type : Neutral
Timeframe : Daily
MACD indicator: bullish divergence
Type : Bullish
Timeframe : Daily
RSI indicator: bullish divergence
Type : Bullish
Timeframe : Daily
Pivot points : price is over resistance 3
Type : Neutral
Timeframe : Daily
Momentum indicator is back over 0
Type : Bullish
Timeframe : Daily
Williams %R indicator is back over -50
Type : Bullish
Timeframe : Daily
The analysis of the price chart with Central Patterns scanners does not return any result.
The Central Candlesticks scanner which studies Japanese candlesticks did not detect anything.
| S3 | S2 | S1 | Price | R1 | R2 | R3 | |
|---|---|---|---|---|---|---|---|
| ProTrendLines | 8,465.8000 | 9,994.2700 | 10,553.4000 | 10,912.0996 | 10,978.4000 | 11,440.8000 | 11,813.2000 |
| Change (%) | -22.42% | -8.41% | -3.29% | - | +0.61% | +4.85% | +8.26% |
| Change | -2,446.2996 | -917.8296 | -358.6996 | - | +66.3004 | +528.7004 | +901.1004 |
| Level | Minor | Major | Intermediate | - | Minor | Intermediate | Minor |
To determine price objectives, it is also possible to use the pivot points. Here is the price position in relation to pivot points:
| Pivot points | S3 | S2 | S1 | PP | R1 | R2 | R3 |
|---|---|---|---|---|---|---|---|
| Standard | 10,407.9329 | 10,508.7663 | 10,710.4329 | 10,811.2663 | 11,012.9329 | 11,113.7663 | 11,315.4329 |
| Camarilla | 10,828.9121 | 10,856.6413 | 10,884.3704 | 10,912.0996 | 10,939.8288 | 10,967.5579 | 10,995.2871 |
| Woodie | 10,458.3496 | 10,533.9746 | 10,760.8496 | 10,836.4746 | 11,063.3496 | 11,138.9746 | 11,365.8496 |
| Fibonacci | 10,508.7663 | 10,624.3213 | 10,695.7113 | 10,811.2663 | 10,926.8213 | 10,998.2113 | 11,113.7663 |
| Pivot points | S3 | S2 | S1 | PP | R1 | R2 | R3 |
|---|---|---|---|---|---|---|---|
| Standard | 10,485.6003 | 10,687.0003 | 10,795.9001 | 10,997.3001 | 11,106.1999 | 11,307.5999 | 11,416.4997 |
| Camarilla | 10,819.4674 | 10,847.9115 | 10,876.3557 | 10,904.7998 | 10,933.2440 | 10,961.6881 | 10,990.1323 |
| Woodie | 10,439.3501 | 10,663.8753 | 10,749.6499 | 10,974.1751 | 11,059.9497 | 11,284.4749 | 11,370.2495 |
| Fibonacci | 10,687.0003 | 10,805.5349 | 10,878.7656 | 10,997.3001 | 11,115.8347 | 11,189.0654 | 11,307.5999 |
| Pivot points | S3 | S2 | S1 | PP | R1 | R2 | R3 |
|---|---|---|---|---|---|---|---|
| Standard | 9,506.5989 | 10,132.5993 | 10,511.6995 | 11,137.6999 | 11,516.8001 | 12,142.8005 | 12,521.9007 |
| Camarilla | 10,614.3971 | 10,706.5314 | 10,798.6656 | 10,890.7998 | 10,982.9340 | 11,075.0682 | 11,167.2025 |
| Woodie | 9,383.1489 | 10,070.8743 | 10,388.2495 | 11,075.9749 | 11,393.3501 | 12,081.0755 | 12,398.4507 |
| Fibonacci | 10,132.5993 | 10,516.5477 | 10,753.7514 | 11,137.6999 | 11,521.6483 | 11,758.8520 | 12,142.8005 |
Numerical data
The following are the details of the technical indicators and moving averages that were collected to generate this technical analysis:
| RSI (14): | 46.74 | |
| MACD (12,26,9): | -116.9924 | |
| Directional Movement: | -5.8274 | |
| AROON (14): | -42.8571 | |
| DEMA (21): | 10,823.4198 | |
| Parabolic SAR (0,02-0,02-0,2): | 11,167.5015 | |
| Elder Ray (13): | -155.1450 | |
| Super Trend (3,10): | 11,189.1196 | |
| Zig ZAG (10): | 10,912.0996 | |
| VORTEX (21): | 0.7213 | |
| Stochastique (14,3,5): | 27.13 | |
| TEMA (21): | 10,787.7156 | |
| Williams %R (14): | -48.65 | |
| Chande Momentum Oscillator (20): | 84.5000 | |
| Repulse (5,40,3): | 2.2930 | |
| ROCnROLL: | -1 | |
| TRIX (15,9): | -0.1544 | |
| Courbe Coppock: | 1.64 |
| MA7: | 10,877.0857 | |
| MA20: | 10,922.4949 | |
| MA50: | 11,184.7160 | |
| MA100: | 11,574.3600 | |
| MAexp7: | 10,866.1175 | |
| MAexp20: | 10,977.4127 | |
| MAexp50: | 11,184.1501 | |
| MAexp100: | 11,493.0532 | |
| Price / MA7: | +0.32% | |
| Price / MA20: | -0.10% | |
| Price / MA50: | -2.44% | |
| Price / MA100: | -5.72% | |
| Price / MAexp7: | +0.42% | |
| Price / MAexp20: | -0.59% | |
| Price / MAexp50: | -2.43% | |
| Price / MAexp100: | -5.05% |
About author
Online


Add a comment
Comments
0 comments on the analysis LATIBEX BRAS - Daily