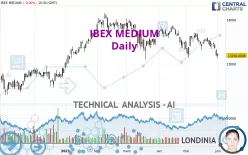
IBEX MEDIUM - Daily - Technical analysis published on 06/01/2023 (GMT)
- 216
- 0
Click here for a new analysis!
- Timeframe : Daily
- - Analysis generated on
- Status : INVALID

Summary of the analysis

Additional analysis
Quotes
The IBEX MEDIUM price is 13,190.7998 EUR. The price has increased by +0.00% since the last closing with the lowest point at 13,131.0996 EUR and the highest point at 13,247.4004 EUR. The deviation from the price is +0.45% for the low point and -0.43% for the high point.The Central Gaps scanner detects a bullish opening. A small advantage for buyers in the very short term.
Bullish opening
Type : Bullish
Timeframe : Openning
Here is a more detailed summary of the historical variations registered by IBEX MEDIUM:
Near a new LOW record (1st january)
Type : Bearish
Timeframe : Weekly
Near a new HIGH record (1 month)
Type : Bullish
Timeframe : Weekly
New LOW record (1 month)
Type : Bearish
Timeframe : Weekly
Technical
Technical analysis of IBEX MEDIUM in Daily shows a overall strongly bearish trend. 89.29% of the signals given by moving averages are bearish. This strongly bearish trend is supported by the strong bearish signals given by short-term moving averages. The Central Indicators market scanner is currently detecting a bearish signal that could impact this trend:
Bearish trend reversal : Moving Average 100
Type : Bearish
Timeframe : Daily
The probability of a further decline is high given the direction of the technical indicators.
But beware of excesses. The Central Indicators scanner currently detects this:
CCI indicator is oversold : under -100
Type : Neutral
Timeframe : Daily
Previous candle closed under Bollinger bands
Type : Neutral
Timeframe : Daily
Williams %R indicator is oversold : under -80
Type : Neutral
Timeframe : Daily
Pivot points : price is under support 3
Type : Neutral
Timeframe : Weekly
Central Patterns, the scanner specializing in chart patterns, did not identify any signals.
The Central Candlesticks scanner, specialised in Japanese candlesticks, did not identify any signals.
| S3 | S2 | S1 | Price | R1 | R2 | R3 | |
|---|---|---|---|---|---|---|---|
| ProTrendLines | 11,580.2000 | 12,325.9000 | 13,010.3000 | 13,190.7998 | 13,351.5000 | 13,573.1000 | 13,822.6000 |
| Change (%) | -12.21% | -6.56% | -1.37% | - | +1.22% | +2.90% | +4.79% |
| Change | -1,610.5998 | -864.8998 | -180.4998 | - | +160.7002 | +382.3002 | +631.8002 |
| Level | Intermediate | Major | Major | - | Intermediate | Intermediate | Intermediate |
Attention could also be paid to pivot points to set price objectives:
| Pivot points | S3 | S2 | S1 | PP | R1 | R2 | R3 |
|---|---|---|---|---|---|---|---|
| Standard | 13,015.8320 | 13,073.4658 | 13,132.1328 | 13,189.7666 | 13,248.4336 | 13,306.0674 | 13,364.7344 |
| Camarilla | 13,158.8171 | 13,169.4780 | 13,180.1389 | 13,190.7998 | 13,201.4607 | 13,212.1216 | 13,222.7825 |
| Woodie | 13,016.3486 | 13,073.7241 | 13,132.6494 | 13,190.0249 | 13,248.9502 | 13,306.3257 | 13,365.2510 |
| Fibonacci | 13,073.4658 | 13,117.8927 | 13,145.3397 | 13,189.7666 | 13,234.1935 | 13,261.6405 | 13,306.0674 |
| Pivot points | S3 | S2 | S1 | PP | R1 | R2 | R3 |
|---|---|---|---|---|---|---|---|
| Standard | 13,052.1321 | 13,195.8659 | 13,317.7327 | 13,461.4665 | 13,583.3333 | 13,727.0671 | 13,848.9339 |
| Camarilla | 13,366.5594 | 13,390.9062 | 13,415.2529 | 13,439.5996 | 13,463.9463 | 13,488.2930 | 13,512.6398 |
| Woodie | 13,041.1987 | 13,190.3992 | 13,306.7993 | 13,455.9998 | 13,572.3999 | 13,721.6004 | 13,838.0005 |
| Fibonacci | 13,195.8659 | 13,297.3253 | 13,360.0070 | 13,461.4665 | 13,562.9259 | 13,625.6076 | 13,727.0671 |
| Pivot points | S3 | S2 | S1 | PP | R1 | R2 | R3 |
|---|---|---|---|---|---|---|---|
| Standard | 12,409.6673 | 12,774.0339 | 12,982.4671 | 13,346.8337 | 13,555.2669 | 13,919.6335 | 14,128.0667 |
| Camarilla | 13,033.3805 | 13,085.8871 | 13,138.3938 | 13,190.9004 | 13,243.4071 | 13,295.9137 | 13,348.4204 |
| Woodie | 12,331.7007 | 12,735.0506 | 12,904.5005 | 13,307.8504 | 13,477.3003 | 13,880.6502 | 14,050.1001 |
| Fibonacci | 12,774.0339 | 12,992.8434 | 13,128.0241 | 13,346.8337 | 13,565.6432 | 13,700.8239 | 13,919.6335 |
Numerical data
The following is the status of technical indicators and moving averages registered at the time this technical analysis was created:
| RSI (14): | 32.89 | |
| MACD (12,26,9): | -76.8708 | |
| Directional Movement: | -21.7381 | |
| AROON (14): | -100.0000 | |
| DEMA (21): | 13,349.8565 | |
| Parabolic SAR (0,02-0,02-0,2): | 13,620.2733 | |
| Elder Ray (13): | -207.0967 | |
| Super Trend (3,10): | 13,568.4789 | |
| Zig ZAG (10): | 13,190.7998 | |
| VORTEX (21): | 0.9438 | |
| Stochastique (14,3,5): | 8.76 | |
| TEMA (21): | 13,305.3383 | |
| Williams %R (14): | -87.41 | |
| Chande Momentum Oscillator (20): | -274.0000 | |
| Repulse (5,40,3): | -1.5190 | |
| ROCnROLL: | 2 | |
| TRIX (15,9): | -0.0490 | |
| Courbe Coppock: | 2.84 |
| MA7: | 13,354.7001 | |
| MA20: | 13,485.6400 | |
| MA50: | 13,551.2460 | |
| MA100: | 13,631.3120 | |
| MAexp7: | 13,331.3213 | |
| MAexp20: | 13,439.1832 | |
| MAexp50: | 13,516.1898 | |
| MAexp100: | 13,465.6490 | |
| Price / MA7: | -1.23% | |
| Price / MA20: | -2.19% | |
| Price / MA50: | -2.66% | |
| Price / MA100: | -3.23% | |
| Price / MAexp7: | -1.05% | |
| Price / MAexp20: | -1.85% | |
| Price / MAexp50: | -2.41% | |
| Price / MAexp100: | -2.04% |
About author
Online


Add a comment
Comments
0 comments on the analysis IBEX MEDIUM - Daily