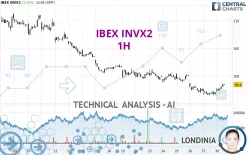
IBEX INVX2 - 1H - Technical analysis published on 09/30/2024 (GMT)
- 142
- 0
Click here for a new analysis!
- Timeframe : 1H
- - Analysis generated on
- Status : INVALID

Summary of the analysis

Additional analysis
Quotes
The IBEX INVX2 price is 98.4000 EUR. The price registered an increase of +1.44% on the session and was between 97.0000 EUR and 98.6000 EUR. This implies that the price is at +1.44% from its lowest and at -0.20% from its highest.The Central Gaps scanner detects the formation of a bullish gap marking the strong presence of buyers against sellers at the opening. This formed a quotation gap.
Opening Gap UP
Type : Bullish
Timeframe : Openning
A study of price movements over other periods shows the following variations:
Near a new LOW record (5 years)
Type : Bearish
Timeframe : Weekly
Near a new LOW record (1 year)
Type : Bearish
Timeframe : Weekly
Near a new LOW record (1st january)
Type : Bearish
Timeframe : Weekly
Near a new LOW record (1 month)
Type : Bearish
Timeframe : Weekly
Technical
A technical analysis in 1H of this IBEX INVX2 chart shows a bearish trend. The signals given by moving averages are 71.43% bearish. This bearish trend could slow down given the neutral signals currently being given by short-term moving averages. An assessment of moving averages reveals a bullish signal that could impact this trend:
Bullish trend reversal : Moving Average 20
Type : Bullish
Timeframe : 1 hour
In fact, 12 technical indicators on 18 studied are currently bullish. Caution: the Central Indicators scanner currently detects an excess:
CCI indicator is overbought : over 100
Type : Neutral
Timeframe : 1 hour
Williams %R indicator is overbought : over -20
Type : Neutral
Timeframe : 1 hour
Pivot points : price is over resistance 2
Type : Neutral
Timeframe : 1 hour
Price is back over the pivot point
Type : Bullish
Timeframe : Weekly
Central Patterns, the scanner specializing in chart patterns, did not identify any signals.
The Central Candlesticks scanner which studies Japanese candlesticks did not detect anything.
| S1 | Price | R1 | R2 | R3 | |
|---|---|---|---|---|---|
| ProTrendLines | 96.5000 | 98.4000 | 100.6111 | 106.2286 | 107.4600 |
| Change (%) | -1.93% | - | +2.25% | +7.96% | +9.21% |
| Change | -1.9000 | - | +2.2111 | +7.8286 | +9.0600 |
| Level | Intermediate | - | Minor | Minor | Major |
Attention could also be paid to pivot points to set price objectives:
| Pivot points | S3 | S2 | S1 | PP | R1 | R2 | R3 |
|---|---|---|---|---|---|---|---|
| Standard | 95.3667 | 95.9333 | 96.4667 | 97.0333 | 97.5667 | 98.1333 | 98.6667 |
| Camarilla | 96.6975 | 96.7983 | 96.8992 | 97.0000 | 97.1008 | 97.2017 | 97.3025 |
| Woodie | 95.3500 | 95.9250 | 96.4500 | 97.0250 | 97.5500 | 98.1250 | 98.6500 |
| Fibonacci | 95.9333 | 96.3535 | 96.6131 | 97.0333 | 97.4535 | 97.7131 | 98.1333 |
| Pivot points | S3 | S2 | S1 | PP | R1 | R2 | R3 |
|---|---|---|---|---|---|---|---|
| Standard | 90.5667 | 93.5333 | 95.2667 | 98.2333 | 99.9667 | 102.9333 | 104.6667 |
| Camarilla | 95.7075 | 96.1383 | 96.5692 | 97.0000 | 97.4308 | 97.8617 | 98.2925 |
| Woodie | 89.9500 | 93.2250 | 94.6500 | 97.9250 | 99.3500 | 102.6250 | 104.0500 |
| Fibonacci | 93.5333 | 95.3287 | 96.4379 | 98.2333 | 100.0287 | 101.1379 | 102.9333 |
| Pivot points | S3 | S2 | S1 | PP | R1 | R2 | R3 |
|---|---|---|---|---|---|---|---|
| Standard | 74.2333 | 90.0667 | 98.3333 | 114.1667 | 122.4333 | 138.2667 | 146.5333 |
| Camarilla | 99.9725 | 102.1817 | 104.3908 | 106.6000 | 108.8092 | 111.0183 | 113.2275 |
| Woodie | 70.4500 | 88.1750 | 94.5500 | 112.2750 | 118.6500 | 136.3750 | 142.7500 |
| Fibonacci | 90.0667 | 99.2729 | 104.9605 | 114.1667 | 123.3729 | 129.0605 | 138.2667 |
Numerical data
The following are the details of the technical indicators and moving averages that were collected to generate this technical analysis:
| RSI (14): | 56.99 | |
| MACD (12,26,9): | -0.2618 | |
| Directional Movement: | 5.7320 | |
| AROON (14): | 92.8571 | |
| DEMA (21): | 97.1943 | |
| Parabolic SAR (0,02-0,02-0,2): | 96.7186 | |
| Elder Ray (13): | 0.6837 | |
| Super Trend (3,10): | 96.6067 | |
| Zig ZAG (10): | 98.5000 | |
| VORTEX (21): | 1.0631 | |
| Stochastique (14,3,5): | 93.51 | |
| TEMA (21): | 97.4751 | |
| Williams %R (14): | 0.00 | |
| Chande Momentum Oscillator (20): | 1.7000 | |
| Repulse (5,40,3): | 1.1103 | |
| ROCnROLL: | -1 | |
| TRIX (15,9): | -0.0686 | |
| Courbe Coppock: | 0.30 |
| MA7: | 98.9714 | |
| MA20: | 103.9500 | |
| MA50: | 110.3400 | |
| MA100: | 111.0940 | |
| MAexp7: | 97.9167 | |
| MAexp20: | 97.6629 | |
| MAexp50: | 98.6296 | |
| MAexp100: | 100.4437 | |
| Price / MA7: | -0.58% | |
| Price / MA20: | -5.34% | |
| Price / MA50: | -10.82% | |
| Price / MA100: | -11.43% | |
| Price / MAexp7: | +0.49% | |
| Price / MAexp20: | +0.75% | |
| Price / MAexp50: | -0.23% | |
| Price / MAexp100: | -2.03% |
About author
Online


Add a comment
Comments
0 comments on the analysis IBEX INVX2 - 1H