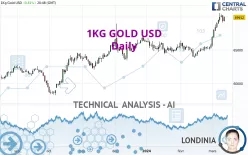
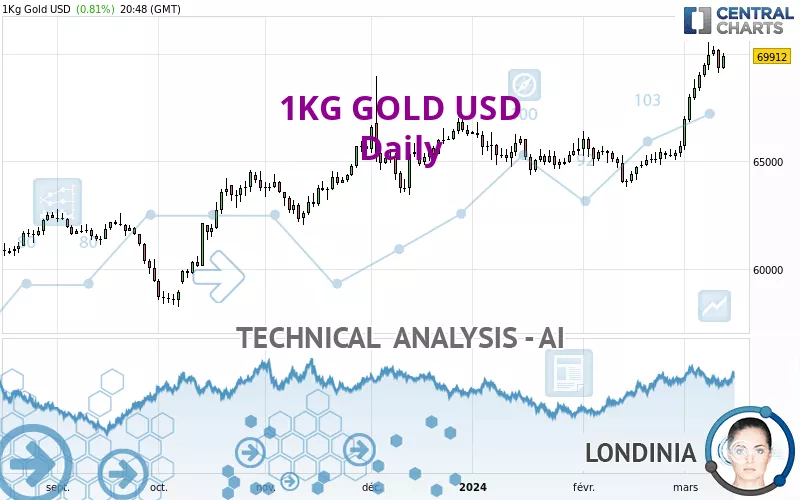
1KG GOLD USD - Daily - Technical analysis published on 03/13/2024 (GMT)
- 193
- 0
- Timeframe : Daily
- - Analysis generated on
- Status : WITHOUT TARGET
Summary of the analysis

Additional analysis
Quotes
1KG GOLD USD rating 69,912 USD. The price has increased by +0.82% since the last closing and was traded between 69,337 USD and 70,085 USD over the period. The price is currently at +0.83% from its lowest and -0.25% from its highest.The Central Gaps scanner detects a bullish opening. A small advantage for buyers in the very short term.
Bullish opening
Type : Bullish
Timeframe : Openning
Here is a more detailed summary of the historical variations registered by 1KG GOLD USD:
Near a new HIGH record (5 years)
Type : Bullish
Timeframe : Weekly
Near a new HIGH record (1 year)
Type : Bullish
Timeframe : Weekly
Near a new HIGH record (1st january)
Type : Bullish
Timeframe : Weekly
Near a new HIGH record (1 month)
Type : Bullish
Timeframe : Weekly
The Central Volumes scanner notes the presence of abnormal volumes:
Abnormal volumes
Timeframe : 5 days
Abnormal volumes
Timeframe : 20 days
Abnormal volumes
Timeframe : 50 days
Technical
A technical analysis in Daily of this 1KG GOLD USD chart shows a strongly bullish trend. The signals given by the moving averages are 92.86% bullish. This strong bullish trend is confirmed by the strong signals currently being given by short-term moving averages. The Central Indicators market scanner currently does not detect any result that concerns moving averages.
In fact, 13 technical indicators on 18 studied are currently positioned bullish. But beware of excesses. The Central Indicators scanner currently detects this:
RSI indicator is overbought : over 70
Type : Neutral
Timeframe : Daily
CCI indicator is overbought : over 100
Type : Neutral
Timeframe : Daily
Williams %R indicator is overbought : over -20
Type : Neutral
Timeframe : Daily
Price is back over the pivot point
Type : Bullish
Timeframe : Daily
The analysis of the price chart with Central Patterns scanners does not return any result.
Central Candlesticks, the scanner specialised in Japanese candlesticks, detects a bullish signal that could support the hypothesis of a small rebound in the very short term:
Bullish harami
Type : Bullish
Timeframe : Daily
| S3 | S2 | S1 | Price | |
|---|---|---|---|---|
| ProTrendLines | 61,390 | 64,029 | 65,886 | 69,912 |
| Change (%) | -12.19% | -8.41% | -5.76% | - |
| Change | -8,522 | -5,883 | -4,026 | - |
| Level | Major | Intermediate | Major | - |
To determine price objectives, it is also possible to use the pivot points. Here is the price position in relation to pivot points:
| Pivot points | S3 | S2 | S1 | PP | R1 | R2 | R3 |
|---|---|---|---|---|---|---|---|
| Standard | 67,825 | 68,485 | 68,916 | 69,576 | 70,007 | 70,667 | 71,098 |
| Camarilla | 69,047 | 69,147 | 69,247 | 69,347 | 69,447 | 69,547 | 69,647 |
| Woodie | 67,711 | 68,428 | 68,802 | 69,519 | 69,893 | 70,610 | 70,984 |
| Fibonacci | 68,485 | 68,902 | 69,159 | 69,576 | 69,993 | 70,250 | 70,667 |
| Pivot points | S3 | S2 | S1 | PP | R1 | R2 | R3 |
|---|---|---|---|---|---|---|---|
| Standard | 63,977 | 65,417 | 67,696 | 69,136 | 71,415 | 72,855 | 75,134 |
| Camarilla | 68,952 | 69,293 | 69,634 | 69,975 | 70,316 | 70,657 | 70,998 |
| Woodie | 64,397 | 65,627 | 68,116 | 69,346 | 71,835 | 73,065 | 75,554 |
| Fibonacci | 65,417 | 66,838 | 67,715 | 69,136 | 70,557 | 71,434 | 72,855 |
| Pivot points | S3 | S2 | S1 | PP | R1 | R2 | R3 |
|---|---|---|---|---|---|---|---|
| Standard | 61,607 | 62,703 | 64,214 | 65,310 | 66,821 | 67,917 | 69,428 |
| Camarilla | 65,009 | 65,248 | 65,487 | 65,726 | 65,965 | 66,204 | 66,443 |
| Woodie | 61,816 | 62,807 | 64,423 | 65,414 | 67,030 | 68,021 | 69,637 |
| Fibonacci | 62,703 | 63,699 | 64,314 | 65,310 | 66,306 | 66,921 | 67,917 |
Numerical data
The following is the status of the technical indicators and moving averages at the time of publication of this technical analysis:
| RSI (14): | 75.00 | |
| MACD (12,26,9): | 1,261.0000 | |
| Directional Movement: | 25 | |
| AROON (14): | 72 | |
| DEMA (21): | 69,042 | |
| Parabolic SAR (0,02-0,02-0,2): | 67,889 | |
| Elder Ray (13): | 1,392 | |
| Super Trend (3,10): | 67,801 | |
| Zig ZAG (10): | 69,900 | |
| VORTEX (21): | 1.0000 | |
| Stochastique (14,3,5): | 87.00 | |
| TEMA (21): | 69,983 | |
| Williams %R (14): | -12.00 | |
| Chande Momentum Oscillator (20): | 4,604 | |
| Repulse (5,40,3): | 1.0000 | |
| ROCnROLL: | 1 | |
| TRIX (15,9): | 0.0000 | |
| Courbe Coppock: | 13.00 |
| MA7: | 69,487 | |
| MA20: | 66,891 | |
| MA50: | 65,899 | |
| MA100: | 65,244 | |
| MAexp7: | 69,225 | |
| MAexp20: | 67,600 | |
| MAexp50: | 66,292 | |
| MAexp100: | 65,313 | |
| Price / MA7: | +0.61% | |
| Price / MA20: | +4.52% | |
| Price / MA50: | +6.09% | |
| Price / MA100: | +7.15% | |
| Price / MAexp7: | +0.99% | |
| Price / MAexp20: | +3.42% | |
| Price / MAexp50: | +5.46% | |
| Price / MAexp100: | +7.04% |
About author

Online


Add a comment
Comments
0 comments on the analysis 1KG GOLD USD - Daily