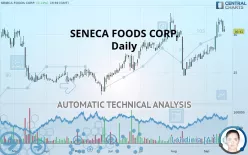
SENECA FOODS CORP. - Daily - Technical analysis published on 09/20/2019 (GMT)
- 169
- 0
- Who voted?
Click here for a new analysis!
- Timeframe : Daily
- - Analysis generated on
- Status : TARGET REACHED

Summary of the analysis

Additional analysis
Quotes
The SENECA FOODS CORP. price is 30.41 USD. The price has increased by +0.13% since the last closing and was between 30.33 USD and 31.14 USD. This implies that the price is at +0.26% from its lowest and at -2.34% from its highest.The Central Gaps scanner detects a bullish opening marking the presence of buyers ahead of sellers at the opening but not sufficiently marked to allow the price to register a quotation gap.
Bullish opening
Type : Bullish
Timeframe : Openning
So that you have an overall view of the price change, here is a table showing the variations over several periods:
Near a new HIGH record (1 month)
Type : Bullish
Timeframe : Weekly
Technical
Technical analysis of this Daily chart of SENECA FOODS CORP. indicates that the overall trend is strongly bullish. 92.86% of the signals given by moving averages are bullish. This strongly bullish trend is supported by the strong bullish signals given by short-term moving averages. An assessment of moving averages reveals a bearish signal that could impact this trend:
Bearish price crossover with adaptative moving average 20
Type : Bearish
Timeframe : Daily
In fact, 13 technical indicators on 18 studied are currently bullish. But beware of excesses. The Central Indicators scanner currently detects this:
CCI indicator is overbought : over 100
Type : Neutral
Timeframe : Daily
RSI indicator: bearish divergence
Type : Bearish
Timeframe : Daily
Williams %R indicator is overbought : over -20
Type : Neutral
Timeframe : Daily
Price is back over the pivot point
Type : Bullish
Timeframe : Weekly
Price is back under the pivot point
Type : Bearish
Timeframe : Daily
The analysis of the price chart with Central Patterns scanners does not return any result.
The Central Candlesticks scanner, specialised in Japanese candlesticks, did not identify any signals.
| S3 | S2 | S1 | Price | R1 | R2 | R3 | |
|---|---|---|---|---|---|---|---|
| ProTrendLines | 25.41 | 27.87 | 30.08 | 30.41 | 31.61 | 33.51 | 36.07 |
| Change (%) | -16.44% | -8.35% | -1.09% | - | +3.95% | +10.19% | +18.61% |
| Change | -5.00 | -2.54 | -0.33 | - | +1.20 | +3.10 | +5.66 |
| Level | Intermediate | Major | Major | - | Major | Major | Intermediate |
Attention could also be paid to pivot points to set price objectives:
| Pivot points | S3 | S2 | S1 | PP | R1 | R2 | R3 |
|---|---|---|---|---|---|---|---|
| Standard | 28.41 | 29.39 | 29.88 | 30.86 | 31.35 | 32.33 | 32.82 |
| Camarilla | 29.97 | 30.10 | 30.24 | 30.37 | 30.51 | 30.64 | 30.77 |
| Woodie | 28.17 | 29.27 | 29.64 | 30.74 | 31.11 | 32.21 | 32.58 |
| Fibonacci | 29.39 | 29.95 | 30.30 | 30.86 | 31.42 | 31.77 | 32.33 |
| Pivot points | S3 | S2 | S1 | PP | R1 | R2 | R3 |
|---|---|---|---|---|---|---|---|
| Standard | 24.32 | 26.02 | 28.81 | 30.52 | 33.31 | 35.01 | 37.80 |
| Camarilla | 30.36 | 30.78 | 31.19 | 31.60 | 32.01 | 32.42 | 32.84 |
| Woodie | 24.86 | 26.29 | 29.35 | 30.79 | 33.85 | 35.28 | 38.34 |
| Fibonacci | 26.02 | 27.74 | 28.80 | 30.52 | 32.23 | 33.29 | 35.01 |
| Pivot points | S3 | S2 | S1 | PP | R1 | R2 | R3 |
|---|---|---|---|---|---|---|---|
| Standard | 16.48 | 20.48 | 23.98 | 27.98 | 31.48 | 35.48 | 38.98 |
| Camarilla | 25.42 | 26.11 | 26.79 | 27.48 | 28.17 | 28.86 | 29.54 |
| Woodie | 16.23 | 20.36 | 23.73 | 27.86 | 31.23 | 35.36 | 38.73 |
| Fibonacci | 20.48 | 23.35 | 25.12 | 27.98 | 30.85 | 32.62 | 35.48 |
Numerical data
The following is the status of technical indicators and moving averages registered at the time this technical analysis was created:
| RSI (14): | 60.70 | |
| MACD (12,26,9): | 0.9300 | |
| Directional Movement: | 17.71 | |
| AROON (14): | 71.43 | |
| DEMA (21): | 30.30 | |
| Parabolic SAR (0,02-0,02-0,2): | 29.98 | |
| Elder Ray (13): | 0.91 | |
| Super Trend (3,10): | 28.57 | |
| Zig ZAG (10): | 30.41 | |
| VORTEX (21): | 1.1700 | |
| Stochastique (14,3,5): | 73.78 | |
| TEMA (21): | 31.09 | |
| Williams %R (14): | -36.86 | |
| Chande Momentum Oscillator (20): | 2.76 | |
| Repulse (5,40,3): | -3.7900 | |
| ROCnROLL: | 1 | |
| TRIX (15,9): | 0.2800 | |
| Courbe Coppock: | 26.68 |
| MA7: | 30.99 | |
| MA20: | 28.68 | |
| MA50: | 28.55 | |
| MA100: | 27.08 | |
| MAexp7: | 30.51 | |
| MAexp20: | 29.29 | |
| MAexp50: | 28.37 | |
| MAexp100: | 27.82 | |
| Price / MA7: | -1.87% | |
| Price / MA20: | +6.03% | |
| Price / MA50: | +6.51% | |
| Price / MA100: | +12.30% | |
| Price / MAexp7: | -0.33% | |
| Price / MAexp20: | +3.82% | |
| Price / MAexp50: | +7.19% | |
| Price / MAexp100: | +9.31% |
News
The latest news and videos published on SENECA FOODS CORP. at the time of the analysis were as follows:
-
 Seneca Foods
- Seneca Foods Reports a Sales Increase of 0.8% or $7.9 Million and Net Earnings of $14.3 Million for the Nine Months Ended December 31, 2016
- SENECA FOODS, Valspar debut industry-leading valPure® can linings in flagship Libby's® brand canned vegetables
- Global Canned Fruits Market 2016-2020: Key Vendors are CHB Group, Del Monte, Dole Food Company, Kraft Heinz, Rhodes Food & Seneca Foods
- Seneca Foods Reports a Sales Increase of 14.1% or $44.0 Million and a Net Earnings of $6.1 Million for the Quarter Ended October 1, 2016
About author

Online


Add a comment
Comments
0 comments on the analysis SENECA FOODS CORP. - Daily