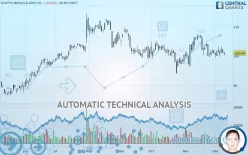
SCOTTS MIRACLE-GRO CO. - Daily - Technical analysis published on 12/11/2019 (GMT)
- 287
- 0
- Who voted?
Click here for a new analysis!
- Timeframe : Daily
- - Analysis generated on
- Status : INVALID

Summary of the analysis

Additional analysis
Quotes
The SCOTTS MIRACLE-GRO CO. price is 100.94 USD. On the day, this instrument lost -0.01% and was traded between 100.29 USD and 101.43 USD over the period. The price is currently at +0.65% from its lowest and -0.48% from its highest.The Central Gaps scanner detects the formation of a bearish gap marking the strong presence of sellers ahead of buyers at the opening. This formed a quotation gap.
Opening Gap DOWN
Type : Bearish
Timeframe : Openning
So that you have an overall view of the price change, here is a table showing the variations over several periods:
Near a new LOW record (1 month)
Type : Bearish
Timeframe : Weekly
Technical
Technical analysis of SCOTTS MIRACLE-GRO CO. in Daily shows an overall bearish trend. The signals given by moving averages are 67.86% bearish. This bearish trend is reinforced by the strong signals currently being given by short-term moving averages. The Central Indicators scanner detects bearish signals on moving averages that could impact this trend:
Bearish price crossover with Moving Average 50
Type : Bearish
Timeframe : Daily
Bearish price crossover with adaptative moving average 20
Type : Bearish
Timeframe : Daily
On the 18 technical indicators analysed, 4 are bullish, 9 are neutral and 5 are bearish. Central Indicators, the detector scanner for these technical indicators has recently detected several signals:
RSI indicator is back under 50
Type : Bearish
Timeframe : Daily
Price is back over the pivot point
Type : Bullish
Timeframe : Weekly
Price is back under the pivot point
Type : Bearish
Timeframe : Daily
Momentum indicator is back under 0
Type : Bearish
Timeframe : Daily
Central Patterns, the market scanner focusing on chart patterns, resistances and supports found these results:
Near support of channel
Type : Bullish
Timeframe : Daily
Near support of triangle
Type : Bullish
Timeframe : Daily
No result was found by the Central Candlesticks scanner on Japanese candlesticks.
| S3 | S2 | S1 | Price | R1 | R2 | R3 | |
|---|---|---|---|---|---|---|---|
| ProTrendLines | 94.24 | 97.03 | 100.03 | 100.94 | 104.24 | 109.47 | 112.33 |
| Change (%) | -6.64% | -3.87% | -0.90% | - | +3.27% | +8.45% | +11.28% |
| Change | -6.70 | -3.91 | -0.91 | - | +3.30 | +8.53 | +11.39 |
| Level | Intermediate | Major | Major | - | Major | Major | Intermediate |
Pivot points can also be used to set your price objectives. Here is the price situation in relation to pivot points:
| Pivot points | S3 | S2 | S1 | PP | R1 | R2 | R3 |
|---|---|---|---|---|---|---|---|
| Standard | 98.59 | 99.70 | 100.33 | 101.43 | 102.06 | 103.17 | 103.79 |
| Camarilla | 100.47 | 100.63 | 100.79 | 100.95 | 101.11 | 101.27 | 101.43 |
| Woodie | 98.35 | 99.58 | 100.08 | 101.31 | 101.82 | 103.04 | 103.55 |
| Fibonacci | 99.70 | 100.36 | 100.77 | 101.43 | 102.09 | 102.50 | 103.17 |
| Pivot points | S3 | S2 | S1 | PP | R1 | R2 | R3 |
|---|---|---|---|---|---|---|---|
| Standard | 96.23 | 97.87 | 100.10 | 101.73 | 103.96 | 105.60 | 107.83 |
| Camarilla | 101.27 | 101.62 | 101.98 | 102.33 | 102.68 | 103.04 | 103.39 |
| Woodie | 96.53 | 98.02 | 100.40 | 101.88 | 104.26 | 105.75 | 108.13 |
| Fibonacci | 97.87 | 99.34 | 100.26 | 101.73 | 103.21 | 104.12 | 105.60 |
| Pivot points | S3 | S2 | S1 | PP | R1 | R2 | R3 |
|---|---|---|---|---|---|---|---|
| Standard | 84.41 | 90.08 | 95.52 | 101.18 | 106.62 | 112.29 | 117.73 |
| Camarilla | 97.91 | 98.92 | 99.94 | 100.96 | 101.98 | 103.00 | 104.01 |
| Woodie | 84.30 | 90.02 | 95.41 | 101.13 | 106.51 | 112.23 | 117.62 |
| Fibonacci | 90.08 | 94.32 | 96.94 | 101.18 | 105.43 | 108.05 | 112.29 |
Numerical data
The following are the details of the technical indicators and moving averages that were collected to generate this technical analysis:
| RSI (14): | 48.15 | |
| MACD (12,26,9): | -0.1200 | |
| Directional Movement: | -4.95 | |
| AROON (14): | -7.14 | |
| DEMA (21): | 101.42 | |
| Parabolic SAR (0,02-0,02-0,2): | 99.58 | |
| Elder Ray (13): | -0.55 | |
| Super Trend (3,10): | 98.44 | |
| Zig ZAG (10): | 100.94 | |
| VORTEX (21): | 0.9600 | |
| Stochastique (14,3,5): | 35.79 | |
| TEMA (21): | 101.26 | |
| Williams %R (14): | -66.84 | |
| Chande Momentum Oscillator (20): | -2.52 | |
| Repulse (5,40,3): | -0.8300 | |
| ROCnROLL: | 2 | |
| TRIX (15,9): | 0.0100 | |
| Courbe Coppock: | 4.14 |
| MA7: | 101.20 | |
| MA20: | 102.22 | |
| MA50: | 101.16 | |
| MA100: | 103.03 | |
| MAexp7: | 101.24 | |
| MAexp20: | 101.49 | |
| MAexp50: | 101.53 | |
| MAexp100: | 100.27 | |
| Price / MA7: | -0.26% | |
| Price / MA20: | -1.25% | |
| Price / MA50: | -0.22% | |
| Price / MA100: | -2.03% | |
| Price / MAexp7: | -0.30% | |
| Price / MAexp20: | -0.54% | |
| Price / MAexp50: | -0.58% | |
| Price / MAexp100: | +0.67% |
News
Don"t forget to follow the news on SCOTTS MIRACLE-GRO CO.. At the time of publication of this analysis, the latest news was as follows:
- Scotts Miracle-Gro Company Class A to Host Earnings Call
- Scotts Miracle-Gro Company Class A to Host Earnings Call
-
 Scotts Miracle-Gro
- ScottsMiracle-Gro Reports Strong First Quarter Results; Company-wide Sales Increase 27% Due to Acquisitions, Strong U.S. Demand
- The Scotts Miracle-Gro Company Announces Quarterly Dividend Payment
About author

Online


Add a comment
Comments
0 comments on the analysis SCOTTS MIRACLE-GRO CO. - Daily