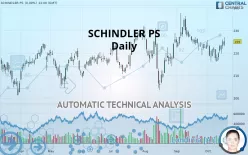
SCHINDLER PS - Daily - Technical analysis published on 10/17/2019 (GMT)
- 193
- 0
- Who voted?
Click here for a new analysis!
- Timeframe : Daily
- - Analysis generated on
- Status : TARGET REACHED

Summary of the analysis

Additional analysis
Quotes
SCHINDLER PS rating 225.00 CHF. The price has increased by +0.00% since the last closing with the lowest point at 222.90 CHF and the highest point at 227.00 CHF. The deviation from the price is +0.94% for the low point and -0.88% for the high point.Here is a more detailed summary of the historical variations registered by SCHINDLER PS:
Technical
Technical analysis of this Daily chart of SCHINDLER PS indicates that the overall trend is bullish. 75% of the signals given by moving averages are bullish. This bullish trend shows slight signs of slowing down given the slightly bullish signals given by the short-term moving averages. The Central Indicators market scanner is currently detecting several bullish signals that could impact this trend:
Bullish trend reversal : adaptative moving average 100
Type : Bullish
Timeframe : Daily
Bullish price crossover with Moving Average 20
Type : Bullish
Timeframe : Daily
Bullish price crossover with Moving Average 50
Type : Bullish
Timeframe : Daily
Bullish price crossover with Moving Average 100
Type : Bullish
Timeframe : Daily
Bullish price crossover with adaptative moving average 20
Type : Bullish
Timeframe : Daily
Bullish price crossover with adaptative moving average 50
Type : Bullish
Timeframe : Daily
Bullish price crossover with adaptative moving average 100
Type : Bullish
Timeframe : Daily
An assessment of technical indicators does not currently provide any relevant information to suggest whether the signal given by the technical indicators is more bullish or bearish.
Caution: the Central Indicators scanner currently detects an excess:
Williams %R indicator is overbought : over -20
Type : Neutral
Timeframe : Daily
RSI indicator is back over 50
Type : Bullish
Timeframe : Daily
Price is back over the pivot point
Type : Bullish
Timeframe : Daily
Momentum indicator is back over 0
Type : Bullish
Timeframe : Daily
Williams %R indicator is back over -50
Type : Bullish
Timeframe : Daily
The Central Patterns scanner, which studies chart patterns, resistances and supports, has identified these signals:
Near resistance of channel
Type : Bearish
Timeframe : Daily
Horizontal resistance is broken
Type : Bullish
Timeframe : Daily
The Central Candlesticks scanner which studies Japanese candlesticks did not detect anything.
| S3 | S2 | S1 | Price | R1 | R2 | R3 | |
|---|---|---|---|---|---|---|---|
| ProTrendLines | 215.27 | 217.88 | 223.04 | 225.00 | 230.91 | 234.70 | 244.80 |
| Change (%) | -4.32% | -3.16% | -0.87% | - | +2.63% | +4.31% | +8.80% |
| Change | -9.73 | -7.12 | -1.96 | - | +5.91 | +9.70 | +19.80 |
| Level | Minor | Minor | Intermediate | - | Major | Intermediate | Minor |
Pivot points can also be used to set your price objectives. Here is the price situation in relation to pivot points:
| Pivot points | S3 | S2 | S1 | PP | R1 | R2 | R3 |
|---|---|---|---|---|---|---|---|
| Standard | 217.37 | 218.73 | 220.87 | 222.23 | 224.37 | 225.73 | 227.87 |
| Camarilla | 222.04 | 222.36 | 222.68 | 223.00 | 223.32 | 223.64 | 223.96 |
| Woodie | 217.75 | 218.93 | 221.25 | 222.43 | 224.75 | 225.93 | 228.25 |
| Fibonacci | 218.73 | 220.07 | 220.90 | 222.23 | 223.57 | 224.40 | 225.73 |
| Pivot points | S3 | S2 | S1 | PP | R1 | R2 | R3 |
|---|---|---|---|---|---|---|---|
| Standard | 207.00 | 211.60 | 216.50 | 221.10 | 226.00 | 230.60 | 235.50 |
| Camarilla | 218.79 | 219.66 | 220.53 | 221.40 | 222.27 | 223.14 | 224.01 |
| Woodie | 207.15 | 211.68 | 216.65 | 221.18 | 226.15 | 230.68 | 235.65 |
| Fibonacci | 211.60 | 215.23 | 217.47 | 221.10 | 224.73 | 226.97 | 230.60 |
| Pivot points | S3 | S2 | S1 | PP | R1 | R2 | R3 |
|---|---|---|---|---|---|---|---|
| Standard | 197.03 | 208.07 | 215.63 | 226.67 | 234.23 | 245.27 | 252.83 |
| Camarilla | 218.09 | 219.79 | 221.50 | 223.20 | 224.91 | 226.61 | 228.32 |
| Woodie | 195.30 | 207.20 | 213.90 | 225.80 | 232.50 | 244.40 | 251.10 |
| Fibonacci | 208.07 | 215.17 | 219.56 | 226.67 | 233.77 | 238.16 | 245.27 |
Numerical data
The following are the details of the technical indicators and moving averages that were collected to generate this technical analysis:
| RSI (14): | 49.19 | |
| MACD (12,26,9): | -0.8100 | |
| Directional Movement: | -1.16 | |
| AROON (14): | -42.86 | |
| DEMA (21): | 220.83 | |
| Parabolic SAR (0,02-0,02-0,2): | 224.85 | |
| Elder Ray (13): | 0.28 | |
| Super Trend (3,10): | 216.26 | |
| Zig ZAG (10): | 221.60 | |
| VORTEX (21): | 0.8700 | |
| Stochastique (14,3,5): | 55.21 | |
| TEMA (21): | 219.73 | |
| Williams %R (14): | -42.71 | |
| Chande Momentum Oscillator (20): | -0.60 | |
| Repulse (5,40,3): | 0.7700 | |
| ROCnROLL: | 1 | |
| TRIX (15,9): | -0.0500 | |
| Courbe Coppock: | 3.13 |
| MA7: | 220.46 | |
| MA20: | 221.99 | |
| MA50: | 221.55 | |
| MA100: | 220.09 | |
| MAexp7: | 220.85 | |
| MAexp20: | 221.72 | |
| MAexp50: | 221.79 | |
| MAexp100: | 220.47 | |
| Price / MA7: | +2.06% | |
| Price / MA20: | +1.36% | |
| Price / MA50: | +1.56% | |
| Price / MA100: | +2.23% | |
| Price / MAexp7: | +1.88% | |
| Price / MAexp20: | +1.48% | |
| Price / MAexp50: | +1.45% | |
| Price / MAexp100: | +2.05% |
About author

Online


Add a comment
Comments
0 comments on the analysis SCHINDLER PS - Daily