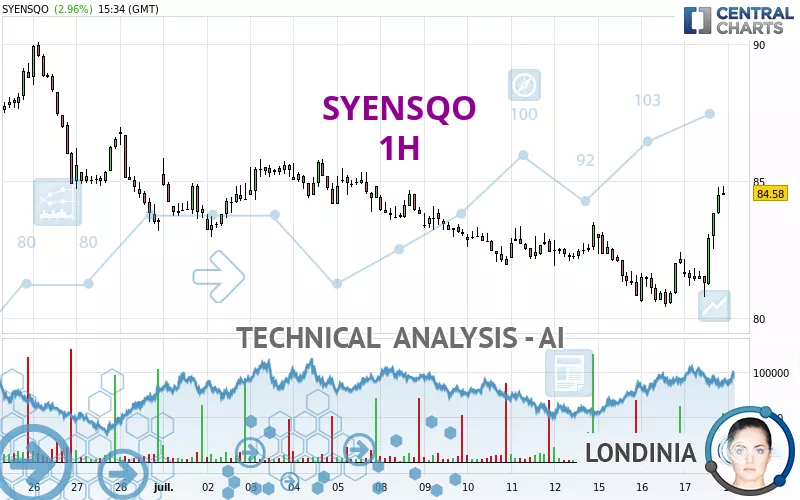
SYENSQO - 1H - Technical analysis published on 07/18/2024 (GMT)
- 138
- 0
Click here for a new analysis!
- Timeframe : 1H
- - Analysis generated on
- Status : INVALID

Summary of the analysis

Additional analysis
Quotes
The SYENSQO price is 84.58 EUR. The price has increased by +2.96% since the last closing with the lowest point at 80.75 EUR and the highest point at 84.81 EUR. The deviation from the price is +4.74% for the low point and -0.27% for the high point.So that you have an overall view of the price change, here is a table showing the variations over several periods:
Near a new LOW record (1 month)
Type : Bearish
Timeframe : Weekly
Technical
A technical analysis in 1H of this SYENSQO chart shows a bullish trend. 71.43% of the signals given by moving averages are bullish. The overall trend is reinforced by the strong bullish signals from short-term moving averages. There is no crossing of moving average by the price or crossing of moving averages between themselves.
In fact, according to the parameters integrated into the Central Analyzer system, 16 technical indicators out of 18 analysed are currently bullish. Caution: the Central Indicators scanner currently detects an excess:
RSI indicator is overbought : over 70
Type : Neutral
Timeframe : 1 hour
CCI indicator is overbought : over 100
Type : Neutral
Timeframe : 1 hour
Previous candle closed over Bollinger bands
Type : Neutral
Timeframe : 1 hour
Williams %R indicator is overbought : over -20
Type : Neutral
Timeframe : 1 hour
Pivot points : price is over resistance 2
Type : Neutral
Timeframe : 1 hour
Price is back over the pivot point
Type : Bullish
Timeframe : Weekly
An analysis of the price chart with the Central Patterns scanner (detector of chart patterns and resistances and supports) shows several results that can have an impact on the price change:
Near horizontal resistance
Type : Bearish
Timeframe : 1 hour
Resistance of channel is broken
Type : Bullish
Timeframe : 1 hour
The Central Candlesticks scanner currently notes the presence of this pattern in Japanese candlesticks that could mark the end of the short-term trend currently underway:
White gravestone / inverted hammer
Type : Neutral
Timeframe : 1 hour
| S3 | S2 | S1 | Price | R1 | R2 | R3 | |
|---|---|---|---|---|---|---|---|
| ProTrendLines | 81.16 | 81.93 | 83.59 | 84.58 | 85.41 | 87.33 | 89.01 |
| Change (%) | -4.04% | -3.13% | -1.17% | - | +0.98% | +3.25% | +5.24% |
| Change | -3.42 | -2.65 | -0.99 | - | +0.83 | +2.75 | +4.43 |
| Level | Minor | Minor | Major | - | Intermediate | Intermediate | Minor |
To determine price objectives, it is also possible to use the pivot points. Here is the price position in relation to pivot points:
| Pivot points | S3 | S2 | S1 | PP | R1 | R2 | R3 |
|---|---|---|---|---|---|---|---|
| Standard | 77.89 | 79.32 | 81.95 | 83.38 | 86.01 | 87.44 | 90.07 |
| Camarilla | 83.46 | 83.84 | 84.21 | 84.58 | 84.95 | 85.32 | 85.70 |
| Woodie | 78.49 | 79.62 | 82.55 | 83.68 | 86.61 | 87.74 | 90.67 |
| Fibonacci | 79.32 | 80.87 | 81.83 | 83.38 | 84.93 | 85.89 | 87.44 |
| Pivot points | S3 | S2 | S1 | PP | R1 | R2 | R3 |
|---|---|---|---|---|---|---|---|
| Standard | 79.20 | 80.55 | 81.98 | 83.33 | 84.76 | 86.11 | 87.54 |
| Camarilla | 82.64 | 82.89 | 83.15 | 83.40 | 83.66 | 83.91 | 84.17 |
| Woodie | 79.23 | 80.57 | 82.01 | 83.35 | 84.79 | 86.13 | 87.57 |
| Fibonacci | 80.55 | 81.62 | 82.27 | 83.33 | 84.40 | 85.05 | 86.11 |
| Pivot points | S3 | S2 | S1 | PP | R1 | R2 | R3 |
|---|---|---|---|---|---|---|---|
| Standard | 67.02 | 75.10 | 79.33 | 87.41 | 91.64 | 99.72 | 103.95 |
| Camarilla | 80.19 | 81.31 | 82.44 | 83.57 | 84.70 | 85.83 | 86.96 |
| Woodie | 65.11 | 74.14 | 77.42 | 86.45 | 89.73 | 98.76 | 102.04 |
| Fibonacci | 75.10 | 79.80 | 82.70 | 87.41 | 92.11 | 95.01 | 99.72 |
Numerical data
The following are the details of the technical indicators and moving averages that were collected to generate this technical analysis:
| RSI (14): | 70.63 | |
| MACD (12,26,9): | 0.4400 | |
| Directional Movement: | 19.58 | |
| AROON (14): | 85.71 | |
| DEMA (21): | 82.74 | |
| Parabolic SAR (0,02-0,02-0,2): | 81.11 | |
| Elder Ray (13): | 1.99 | |
| Super Trend (3,10): | 82.38 | |
| Zig ZAG (10): | 84.58 | |
| VORTEX (21): | 1.2100 | |
| Stochastique (14,3,5): | 95.99 | |
| TEMA (21): | 83.40 | |
| Williams %R (14): | -5.22 | |
| Chande Momentum Oscillator (20): | 4.06 | |
| Repulse (5,40,3): | 2.0500 | |
| ROCnROLL: | 1 | |
| TRIX (15,9): | 0.0000 | |
| Courbe Coppock: | 4.93 |
| MA7: | 82.63 | |
| MA20: | 84.77 | |
| MA50: | 89.19 | |
| MA100: | 86.86 | |
| MAexp7: | 83.29 | |
| MAexp20: | 82.37 | |
| MAexp50: | 82.42 | |
| MAexp100: | 83.27 | |
| Price / MA7: | +2.36% | |
| Price / MA20: | -0.22% | |
| Price / MA50: | -5.17% | |
| Price / MA100: | -2.62% | |
| Price / MAexp7: | +1.55% | |
| Price / MAexp20: | +2.68% | |
| Price / MAexp50: | +2.62% | |
| Price / MAexp100: | +1.57% |
News
The latest news and videos published on SYENSQO at the time of the analysis were as follows:
- Syensqo - Acquisition of own shares
- Participation notification by BlackRock Inc.
- Participation Notification by Blackrock Inc.
- Outcome of Syensqo’s 2024 Annual General Meeting
- Notice of Syensqo’s Annual General Meeting on May 23, 2024
About author
Online


Add a comment
Comments
0 comments on the analysis SYENSQO - 1H