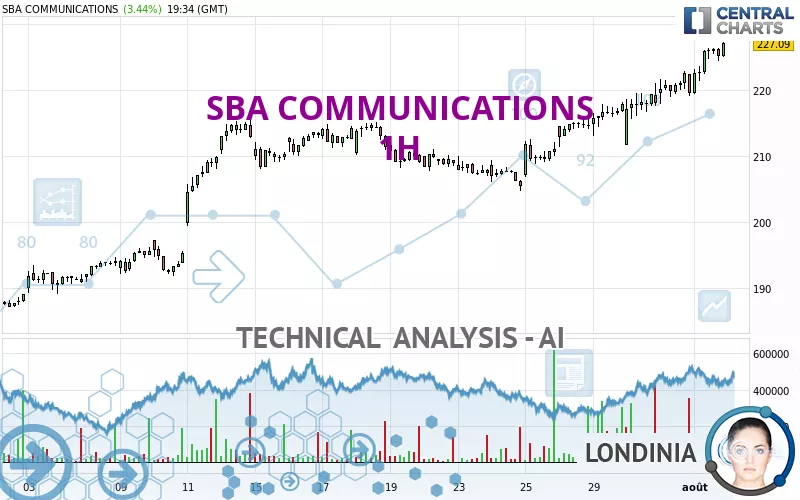
SBA COMMUNICATIONS - 1H - Technical analysis published on 08/01/2024 (GMT)
- 190
- 0
Click here for a new analysis!
- Timeframe : 1H
- - Analysis generated on
- Status : LEVEL MAINTAINED
Summary of the analysis

Additional analysis
Quotes
The SBA COMMUNICATIONS price is 226.12 USD. On the day, this instrument gained +3.00% and was between 219.34 USD and 226.35 USD. This implies that the price is at +3.09% from its lowest and at -0.10% from its highest.A bullish opening was detected by the Central Gaps scanner. Buyers are trying to impose a bullish momentum in the very short term.
Bullish opening
Type : Bullish
Timeframe : Openning
So that you have an overall view of the price change, here is a table showing the variations over several periods:
New HIGH record (1 month)
Type : Bullish
Timeframe : Weekly
Technical
Technical analysis of SBA COMMUNICATIONS in 1H shows a strongly overall bullish trend. 92.86% of the signals given by moving averages are bullish. The overall trend is supported by the strong bullish signals from short-term moving averages. The Central Indicators market scanner currently does not detect any result that concerns moving averages.
In fact, 13 technical indicators on 18 studied are currently positioned bullish. But beware of excesses. The Central Indicators scanner currently detects this:
CCI indicator is overbought : over 100
Type : Neutral
Timeframe : 1 hour
Williams %R indicator is overbought : over -20
Type : Neutral
Timeframe : 1 hour
Pivot points : price is over resistance 2
Type : Neutral
Timeframe : 1 hour
Pivot points : price is over resistance 2
Type : Neutral
Timeframe : Weekly
The Central Patterns scanner, which studies chart patterns, resistances and supports, has identified this signal:
Near horizontal resistance
Type : Bearish
Timeframe : 1 hour
No result was found by the Central Candlesticks scanner on Japanese candlesticks.
| S3 | S2 | S1 | Price | R1 | R2 | R3 | |
|---|---|---|---|---|---|---|---|
| ProTrendLines | 204.57 | 217.16 | 221.58 | 226.12 | 237.33 | 243.99 | 253.37 |
| Change (%) | -9.53% | -3.96% | -2.01% | - | +4.96% | +7.90% | +12.05% |
| Change | -21.55 | -8.96 | -4.54 | - | +11.21 | +17.87 | +27.25 |
| Level | Minor | Major | Intermediate | - | Minor | Minor | Intermediate |
Attention could also be paid to pivot points to set price objectives:
| Pivot points | S3 | S2 | S1 | PP | R1 | R2 | R3 |
|---|---|---|---|---|---|---|---|
| Standard | 212.37 | 215.13 | 217.33 | 220.09 | 222.29 | 225.05 | 227.25 |
| Camarilla | 218.18 | 218.63 | 219.09 | 219.54 | 220.00 | 220.45 | 220.90 |
| Woodie | 212.10 | 214.99 | 217.06 | 219.95 | 222.02 | 224.91 | 226.98 |
| Fibonacci | 215.13 | 217.02 | 218.19 | 220.09 | 221.98 | 223.15 | 225.05 |
| Pivot points | S3 | S2 | S1 | PP | R1 | R2 | R3 |
|---|---|---|---|---|---|---|---|
| Standard | 196.50 | 200.54 | 207.62 | 211.66 | 218.74 | 222.78 | 229.86 |
| Camarilla | 211.65 | 212.67 | 213.69 | 214.71 | 215.73 | 216.75 | 217.77 |
| Woodie | 198.03 | 201.30 | 209.15 | 212.42 | 220.27 | 223.54 | 231.39 |
| Fibonacci | 200.54 | 204.79 | 207.41 | 211.66 | 215.91 | 218.53 | 222.78 |
| Pivot points | S3 | S2 | S1 | PP | R1 | R2 | R3 |
|---|---|---|---|---|---|---|---|
| Standard | 161.01 | 174.03 | 196.79 | 209.81 | 232.57 | 245.59 | 268.35 |
| Camarilla | 209.70 | 212.98 | 216.26 | 219.54 | 222.82 | 226.10 | 229.38 |
| Woodie | 165.87 | 176.47 | 201.65 | 212.25 | 237.43 | 248.03 | 273.21 |
| Fibonacci | 174.03 | 187.70 | 196.15 | 209.81 | 223.48 | 231.93 | 245.59 |
Numerical data
The following are the details of the technical indicators and moving averages that were collected to generate this technical analysis:
| RSI (14): | 68.11 | |
| MACD (12,26,9): | 2.7500 | |
| Directional Movement: | 9.91 | |
| AROON (14): | 85.71 | |
| DEMA (21): | 225.33 | |
| Parabolic SAR (0,02-0,02-0,2): | 223.01 | |
| Elder Ray (13): | 2.05 | |
| Super Trend (3,10): | 218.86 | |
| Zig ZAG (10): | 225.36 | |
| VORTEX (21): | 1.1500 | |
| Stochastique (14,3,5): | 90.92 | |
| TEMA (21): | 226.15 | |
| Williams %R (14): | -11.28 | |
| Chande Momentum Oscillator (20): | 5.04 | |
| Repulse (5,40,3): | 0.5800 | |
| ROCnROLL: | 1 | |
| TRIX (15,9): | 0.1700 | |
| Courbe Coppock: | 5.58 |
| MA7: | 216.01 | |
| MA20: | 209.20 | |
| MA50: | 199.73 | |
| MA100: | 202.00 | |
| MAexp7: | 224.60 | |
| MAexp20: | 221.71 | |
| MAexp50: | 217.45 | |
| MAexp100: | 213.01 | |
| Price / MA7: | +4.68% | |
| Price / MA20: | +8.09% | |
| Price / MA50: | +13.21% | |
| Price / MA100: | +11.94% | |
| Price / MAexp7: | +0.68% | |
| Price / MAexp20: | +1.99% | |
| Price / MAexp50: | +3.99% | |
| Price / MAexp100: | +6.15% |
News
Don't forget to follow the news on SBA COMMUNICATIONS. At the time of publication of this analysis, the latest news was as follows:
- SBA Communications Corporation to Speak at the Goldman Sachs 2023 Communacopia + Technology Conference
- SBA Communications Corporation Reports Second Quarter 2023 Results; Updates Full Year 2023 Outlook; Declares Quarterly Cash Dividend; and Announces Newly Signed Master Lease Agreement with AT&T
- SBA Communications Corporation Sets Date for Second Quarter 2023 Earnings Release
- SBA Communications Corporation to Speak at the JP Morgan 51st Annual Global Technology, Media and Communications Conference
- SBA Communications Corporation to Speak at the MoffettNathanson Inaugural Technology, Media and Telecom Conference
About author
Online


Add a comment
Comments
0 comments on the analysis SBA COMMUNICATIONS - 1H