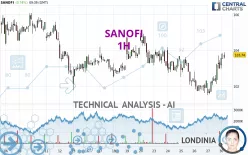
SANOFI - 1H - Technical analysis published on 09/30/2024 (GMT)
- 126
- 0
Click here for a new analysis!
- Timeframe : 1H
- - Analysis generated on
- Status : INVALID
Summary of the analysis

Additional analysis
Quotes
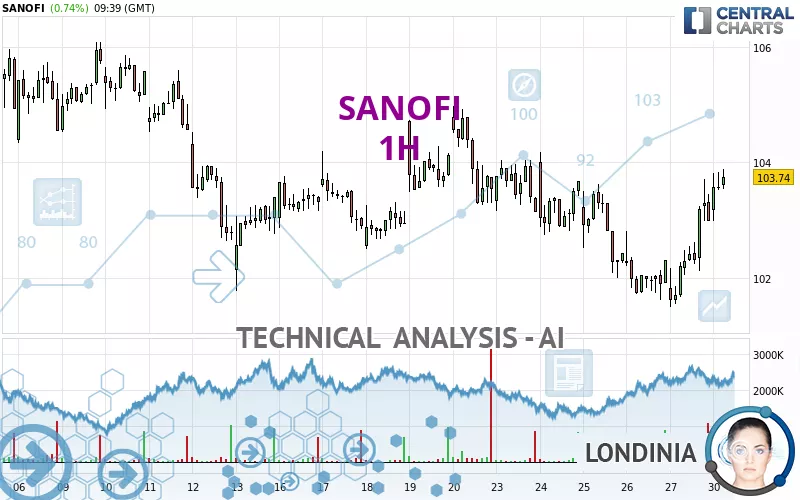
The SANOFI rating is 103.74 EUR. The price has increased by +0.74% since the last closing and was traded between 102.98 EUR and 103.88 EUR over the period. The price is currently at +0.74% from its lowest and -0.13% from its highest.The Central Gaps scanner detects a bullish opening. A small advantage for buyers in the very short term.
Bullish opening
Type : Bullish
Timeframe : Openning
So that you have an overall view of the price change, here is a table showing the variations over several periods:
Near a new HIGH record (5 years)
Type : Bullish
Timeframe : Weekly
Near a new HIGH record (1 year)
Type : Bullish
Timeframe : Weekly
Near a new HIGH record (1st january)
Type : Bullish
Timeframe : Weekly
Near a new HIGH record (1 month)
Type : Bullish
Timeframe : Weekly
Technical
Technical analysis of SANOFI in 1H shows an overall bullish trend. 71.43% of the signals given by moving averages are bullish. This bullish trend is supported by the strong bullish signals given by short-term moving averages. The Central Indicators market scanner is currently detecting a bullish signal that could impact this trend:
Bullish trend reversal : Moving Average 50
Type : Bullish
Timeframe : 1 hour
In fact, 16 technical indicators on 18 studied are currently positioned bullish. Caution: the Central Indicators scanner currently detects an excess:
CCI indicator is overbought : over 100
Type : Neutral
Timeframe : 1 hour
Williams %R indicator is overbought : over -20
Type : Neutral
Timeframe : 1 hour
Ichimoku : price is over the cloud
Type : Bullish
Timeframe : 1 hour
An analysis of the price chart with the Central Patterns scanner (detector of chart patterns and resistances and supports) shows several results that can have an impact on the price change:
Near horizontal resistance
Type : Bearish
Timeframe : 1 hour
Resistance of channel is broken
Type : Bullish
Timeframe : 1 hour
The Central Candlesticks scanner which studies Japanese candlesticks did not detect anything.
| S3 | S2 | S1 | Price | R1 | R2 | R3 | |
|---|---|---|---|---|---|---|---|
| ProTrendLines | 101.78 | 102.80 | 103.65 | 103.74 | 104.19 | 104.97 | 105.76 |
| Change (%) | -1.89% | -0.91% | -0.09% | - | +0.43% | +1.19% | +1.95% |
| Change | -1.96 | -0.94 | -0.09 | - | +0.45 | +1.23 | +2.02 |
| Level | Intermediate | Major | Minor | - | Minor | Intermediate | Major |
To determine price objectives, it is also possible to use the pivot points. Here is the price position in relation to pivot points:
| Pivot points | S3 | S2 | S1 | PP | R1 | R2 | R3 |
|---|---|---|---|---|---|---|---|
| Standard | 99.53 | 100.51 | 101.75 | 102.73 | 103.97 | 104.95 | 106.19 |
| Camarilla | 102.37 | 102.57 | 102.78 | 102.98 | 103.18 | 103.39 | 103.59 |
| Woodie | 99.65 | 100.58 | 101.87 | 102.80 | 104.09 | 105.02 | 106.31 |
| Fibonacci | 100.51 | 101.36 | 101.89 | 102.73 | 103.58 | 104.11 | 104.95 |
| Pivot points | S3 | S2 | S1 | PP | R1 | R2 | R3 |
|---|---|---|---|---|---|---|---|
| Standard | 98.91 | 100.21 | 101.59 | 102.89 | 104.27 | 105.57 | 106.95 |
| Camarilla | 102.24 | 102.49 | 102.73 | 102.98 | 103.23 | 103.47 | 103.72 |
| Woodie | 98.96 | 100.23 | 101.64 | 102.91 | 104.32 | 105.59 | 107.00 |
| Fibonacci | 100.21 | 101.23 | 101.86 | 102.89 | 103.91 | 104.54 | 105.57 |
| Pivot points | S3 | S2 | S1 | PP | R1 | R2 | R3 |
|---|---|---|---|---|---|---|---|
| Standard | 84.51 | 88.24 | 94.72 | 98.45 | 104.93 | 108.66 | 115.14 |
| Camarilla | 98.39 | 99.33 | 100.26 | 101.20 | 102.14 | 103.07 | 104.01 |
| Woodie | 85.89 | 88.93 | 96.10 | 99.14 | 106.31 | 109.35 | 116.52 |
| Fibonacci | 88.24 | 92.14 | 94.55 | 98.45 | 102.35 | 104.76 | 108.66 |
Numerical data
The following are the details of the technical indicators and moving averages that were collected to generate this technical analysis:
| RSI (14): | 62.15 | |
| MACD (12,26,9): | 0.1900 | |
| Directional Movement: | 17.14 | |
| AROON (14): | 71.43 | |
| DEMA (21): | 102.93 | |
| Parabolic SAR (0,02-0,02-0,2): | 102.70 | |
| Elder Ray (13): | 0.64 | |
| Super Trend (3,10): | 102.13 | |
| Zig ZAG (10): | 103.62 | |
| VORTEX (21): | 1.1100 | |
| Stochastique (14,3,5): | 90.28 | |
| TEMA (21): | 103.32 | |
| Williams %R (14): | -7.69 | |
| Chande Momentum Oscillator (20): | 1.34 | |
| Repulse (5,40,3): | 0.2600 | |
| ROCnROLL: | 1 | |
| TRIX (15,9): | -0.0100 | |
| Courbe Coppock: | 2.40 |
| MA7: | 103.11 | |
| MA20: | 103.80 | |
| MA50: | 100.02 | |
| MA100: | 95.19 | |
| MAexp7: | 103.25 | |
| MAexp20: | 102.80 | |
| MAexp50: | 102.89 | |
| MAexp100: | 103.10 | |
| Price / MA7: | +0.61% | |
| Price / MA20: | -0.06% | |
| Price / MA50: | +3.72% | |
| Price / MA100: | +8.98% | |
| Price / MAexp7: | +0.47% | |
| Price / MAexp20: | +0.91% | |
| Price / MAexp50: | +0.83% | |
| Price / MAexp100: | +0.62% |
News
The last news published on SANOFI at the time of the generation of this analysis was as follows:
- Press Release: Dupixent approved in the US as the first-ever biologic medicine for patients with COPD
- Press Release: Availability of the Q3 2024 Aide mémoire
- Press Release: Sarclisa approved in the US as the first anti-CD38 therapy in combination with standard-of-care treatment for adult patients with newly diagnosed multiple myeloma not eligible for transplant
- Press Release: Dupixent recommended for EU approval by the CHMP to treat eosinophilic esophagitis in children as young as 1 year old
- Press Release: Tolebrutinib demonstrated a 31% delay in time to onset of confirmed disability progression in non-relapsing secondary progressive multiple sclerosis phase 3 study
About author
Online


Add a comment
Comments
0 comments on the analysis SANOFI - 1H