SANOFI - 1H - Technical analysis published on 09/02/2024 (GMT)
- 132
- 0
- Timeframe : 1H
- - Analysis generated on
- Status : WITHOUT TARGET
Summary of the analysis

Additional analysis
Quotes
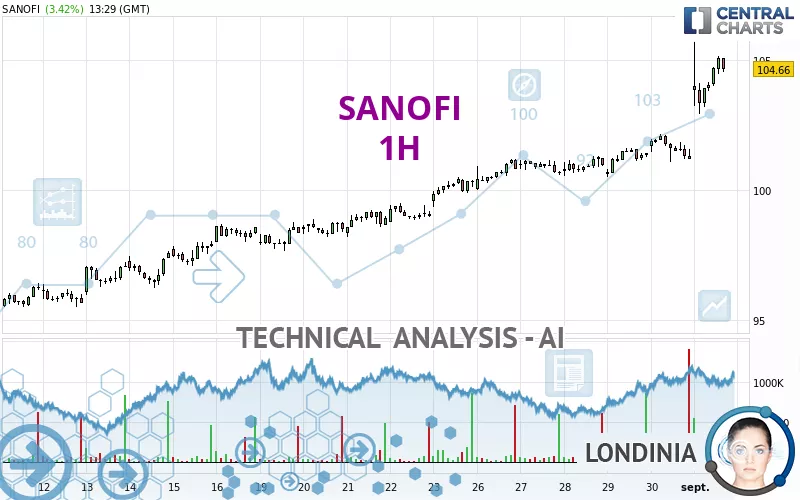
The SANOFI price is 104.66 EUR. The price registered an increase of +3.42% on the session with the lowest point at 102.94 EUR and the highest point at 105.70 EUR. The deviation from the price is +1.67% for the low point and -0.98% for the high point.The Central Gaps scanner detects a bullish gap which is a sign that buyers have taken the lead in the very short term.
Opening Gap UP
Type : Bullish
Timeframe : Openning
A study of price movements over other periods shows the following variations:
New HIGH record (5 years)
Type : Bullish
Timeframe : Weekly
New HIGH record (1 year)
Type : Bullish
Timeframe : Weekly
New HIGH record (1st january)
Type : Bullish
Timeframe : Weekly
New HIGH record (1 month)
Type : Bullish
Timeframe : Weekly
Technical
Technical analysis of this 1H chart of SANOFI indicates that the overall trend is strongly bullish. 92.86% of the signals given by moving averages are bullish. This strongly bullish trend is supported by the strong bullish signals given by short-term moving averages. There is no crossing of moving average by the price or crossing of moving averages between themselves.
Technical indicators are strongly bullish, suggesting that the price increase should continue.
Caution: the Central Indicators scanner currently detects an excess:
RSI indicator is overbought : over 70
Type : Neutral
Timeframe : 1 hour
CCI indicator is overbought : over 100
Type : Neutral
Timeframe : 1 hour
Williams %R indicator is overbought : over -20
Type : Neutral
Timeframe : 1 hour
Pivot points : price is over resistance 3
Type : Neutral
Timeframe : 1 hour
Pivot points : price is over resistance 3
Type : Neutral
Timeframe : Weekly
The Central Patterns scanner, which studies chart patterns, resistances and supports, has identified these signals:
Near horizontal resistance
Type : Bearish
Timeframe : 1 hour
Resistance of channel is broken
Type : Bullish
Timeframe : 1 hour
No result was found by the Central Candlesticks scanner on Japanese candlesticks.
| S3 | S2 | S1 | Price | |
|---|---|---|---|---|
| ProTrendLines | 97.49 | 99.84 | 102.18 | 104.66 |
| Change (%) | -6.85% | -4.61% | -2.37% | - |
| Change | -7.17 | -4.82 | -2.48 | - |
| Level | Intermediate | Major | Intermediate | - |
To determine price objectives, it is also possible to use the pivot points. Here is the price position in relation to pivot points:
| Pivot points | S3 | S2 | S1 | PP | R1 | R2 | R3 |
|---|---|---|---|---|---|---|---|
| Standard | 99.69 | 100.39 | 100.79 | 101.49 | 101.89 | 102.59 | 102.99 |
| Camarilla | 100.90 | 101.00 | 101.10 | 101.20 | 101.30 | 101.40 | 101.50 |
| Woodie | 99.55 | 100.32 | 100.65 | 101.42 | 101.75 | 102.52 | 102.85 |
| Fibonacci | 100.39 | 100.81 | 101.07 | 101.49 | 101.91 | 102.17 | 102.59 |
| Pivot points | S3 | S2 | S1 | PP | R1 | R2 | R3 |
|---|---|---|---|---|---|---|---|
| Standard | 97.88 | 98.93 | 100.07 | 101.12 | 102.26 | 103.31 | 104.45 |
| Camarilla | 100.60 | 100.80 | 101.00 | 101.20 | 101.40 | 101.60 | 101.80 |
| Woodie | 97.92 | 98.95 | 100.11 | 101.14 | 102.30 | 103.33 | 104.49 |
| Fibonacci | 98.93 | 99.77 | 100.29 | 101.12 | 101.96 | 102.48 | 103.31 |
| Pivot points | S3 | S2 | S1 | PP | R1 | R2 | R3 |
|---|---|---|---|---|---|---|---|
| Standard | 84.51 | 88.24 | 94.72 | 98.45 | 104.93 | 108.66 | 115.14 |
| Camarilla | 98.39 | 99.33 | 100.26 | 101.20 | 102.14 | 103.07 | 104.01 |
| Woodie | 85.89 | 88.93 | 96.10 | 99.14 | 106.31 | 109.35 | 116.52 |
| Fibonacci | 88.24 | 92.14 | 94.55 | 98.45 | 102.35 | 104.76 | 108.66 |
Numerical data
The following is the status of technical indicators and moving averages registered at the time this technical analysis was created:
| RSI (14): | 73.43 | |
| MACD (12,26,9): | 0.9300 | |
| Directional Movement: | 37.79 | |
| AROON (14): | 35.71 | |
| DEMA (21): | 103.98 | |
| Parabolic SAR (0,02-0,02-0,2): | 101.61 | |
| Elder Ray (13): | 1.52 | |
| Super Trend (3,10): | 102.74 | |
| Zig ZAG (10): | 104.68 | |
| VORTEX (21): | 1.1100 | |
| Stochastique (14,3,5): | 80.81 | |
| TEMA (21): | 104.48 | |
| Williams %R (14): | -22.94 | |
| Chande Momentum Oscillator (20): | 2.90 | |
| Repulse (5,40,3): | 0.2200 | |
| ROCnROLL: | 1 | |
| TRIX (15,9): | 0.0800 | |
| Courbe Coppock: | 4.65 |
| MA7: | 101.45 | |
| MA20: | 98.63 | |
| MA50: | 95.23 | |
| MA100: | 91.80 | |
| MAexp7: | 104.08 | |
| MAexp20: | 102.91 | |
| MAexp50: | 101.72 | |
| MAexp100: | 100.49 | |
| Price / MA7: | +3.16% | |
| Price / MA20: | +6.11% | |
| Price / MA50: | +9.90% | |
| Price / MA100: | +14.01% | |
| Price / MAexp7: | +0.56% | |
| Price / MAexp20: | +1.70% | |
| Price / MAexp50: | +2.89% | |
| Price / MAexp100: | +4.15% |
News
The latest news and videos published on SANOFI at the time of the analysis were as follows:
- Press Release: Tolebrutinib meets primary endpoint in HERCULES phase 3 study, the first and only to show reduction in disability accumulation in non-relapsing secondary progressive multiple sclerosis
- Sanofi: Information concerning the total number of voting rights and shares - July 2024
- Press Release: Sarclisa induction treatment demonstrated significantly improved progression-free survival in patients with newly diagnosed multiple myeloma eligible for transplant
- Press Release: NEJM publishes ALTUVIIIO XTEND-Kids phase 3 data supporting its potential to transform the treatment landscape for children with severe hemophilia A
- Press Release: Dupixent positive phase 3 data in children one to 11 years of age with eosinophilic esophagitis published in NEJM
About author
Online


Add a comment
Comments
0 comments on the analysis SANOFI - 1H