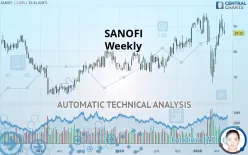
SANOFI - Weekly - Technical analysis published on 05/17/2020 (GMT)
- 495
- 0
- Who voted?
Click here for a new analysis!
- Timeframe : Weekly
- - Analysis generated on
- Status : TARGET REACHED

Summary of the analysis

Additional analysis
Quotes
SANOFI rating 87.22 EUR. Over 5 days, this instrument lost -2.62% and has been traded over the last 5 days between 86.57 EUR and 91.14 EUR. This implies that the 5 day price is +0.75% from its lowest point and -4.30% from its highest point.A bullish opening was detected by the Central Gaps scanner. Buyers are trying to impose a bullish momentum in the very short term.
Bullish opening
Type : Bullish
Timeframe : Openning
A study of price movements over other periods shows the following variations:
New HIGH record (5 years)
Type : Bullish
Timeframe : Weekly
Near a new HIGH record (5 years)
Type : Bullish
Timeframe : Weekly
Near a new HIGH record (1st january)
Type : Bullish
Timeframe : Weekly
Near a new HIGH record (1 month)
Type : Bullish
Timeframe : Weekly
Technical
Technical analysis of SANOFI in Weekly shows a strongly overall bullish trend. 89.29% of the signals given by moving averages are bullish. The slightly bullish signals given by the short-term moving averages indicate this trend is showing signs of running out of steam. The Central Indicators market scanner currently does not detect any result that concerns moving averages.
In fact, Central Analyzer took into account 18 technical indicators and the result was as follows: 11 are bullish, 3 are neutral and 4 are bearish. Caution: the Central Indicators scanner currently detects an excess:
Williams %R indicator is overbought : over -20
Type : Neutral
Timeframe : Weekly
Aroon indicator bullish trend
Type : Bullish
Timeframe : Weekly
Momentum indicator is back over 0
Type : Bullish
Timeframe : Weekly
No signals are given by Central Patterns, a market scanner specialised in chart patterns, resistances and supports.
No result was found by the Central Candlesticks scanner on Japanese candlesticks.
| S3 | S2 | S1 | Price | R1 | R2 | |
|---|---|---|---|---|---|---|
| ProTrendLines | 72.31 | 78.77 | 86.53 | 87.22 | 92.97 | 100.65 |
| Change (%) | -17.09% | -9.69% | -0.79% | - | +6.59% | +15.40% |
| Change | -14.91 | -8.45 | -0.69 | - | +5.75 | +13.43 |
| Level | Major | Major | Major | - | Major | Intermediate |
Attention could also be paid to pivot points to set price objectives:
| Pivot points | S3 | S2 | S1 | PP | R1 | R2 | R3 |
|---|---|---|---|---|---|---|---|
| Standard | 84.47 | 85.83 | 87.01 | 88.37 | 89.55 | 90.91 | 92.09 |
| Camarilla | 87.48 | 87.71 | 87.95 | 88.18 | 88.41 | 88.65 | 88.88 |
| Woodie | 84.37 | 85.79 | 86.91 | 88.33 | 89.45 | 90.87 | 91.99 |
| Fibonacci | 85.83 | 86.80 | 87.40 | 88.37 | 89.34 | 89.94 | 90.91 |
| Pivot points | S3 | S2 | S1 | PP | R1 | R2 | R3 |
|---|---|---|---|---|---|---|---|
| Standard | 80.51 | 83.60 | 86.59 | 89.68 | 92.67 | 95.76 | 98.75 |
| Camarilla | 87.90 | 88.46 | 89.01 | 89.57 | 90.13 | 90.69 | 91.24 |
| Woodie | 80.45 | 83.58 | 86.53 | 89.66 | 92.61 | 95.74 | 98.69 |
| Fibonacci | 83.60 | 85.93 | 87.36 | 89.68 | 92.01 | 93.44 | 95.76 |
| Pivot points | S3 | S2 | S1 | PP | R1 | R2 | R3 |
|---|---|---|---|---|---|---|---|
| Standard | 58.15 | 65.79 | 75.91 | 83.56 | 93.68 | 101.33 | 111.45 |
| Camarilla | 81.15 | 82.78 | 84.41 | 86.04 | 87.67 | 89.30 | 90.93 |
| Woodie | 59.39 | 66.41 | 77.16 | 84.18 | 94.93 | 101.95 | 112.69 |
| Fibonacci | 65.79 | 72.58 | 76.77 | 83.56 | 90.35 | 94.54 | 101.33 |
Numerical data
The following is the status of the technical indicators and moving averages at the time of publication of this technical analysis:
| RSI (14): | 56.31 | |
| MACD (12,26,9): | 1.3000 | |
| Directional Movement: | 4.57 | |
| AROON (14): | 50.00 | |
| DEMA (21): | 84.80 | |
| Parabolic SAR (0,02-0,02-0,2): | 68.32 | |
| Elder Ray (13): | 5.19 | |
| Super Trend (3,10): | 89.70 | |
| Zig ZAG (10): | 87.22 | |
| VORTEX (21): | 0.9900 | |
| Stochastique (14,3,5): | 82.24 | |
| TEMA (21): | 84.57 | |
| Williams %R (14): | -20.20 | |
| Chande Momentum Oscillator (20): | -2.81 | |
| Repulse (5,40,3): | -2.0400 | |
| ROCnROLL: | 1 | |
| TRIX (15,9): | 0.1100 | |
| Courbe Coppock: | 6.78 |
| MA7: | 89.31 | |
| MA20: | 88.08 | |
| MA50: | 81.38 | |
| MA100: | 84.40 | |
| MAexp7: | 85.14 | |
| MAexp20: | 83.18 | |
| MAexp50: | 80.28 | |
| MAexp100: | 76.48 | |
| Price / MA7: | -2.34% | |
| Price / MA20: | -0.98% | |
| Price / MA50: | +7.18% | |
| Price / MA100: | +3.34% | |
| Price / MAexp7: | +2.44% | |
| Price / MAexp20: | +4.86% | |
| Price / MAexp50: | +8.64% | |
| Price / MAexp100: | +14.04% |
News
The latest news and videos published on SANOFI at the time of the analysis were as follows:
- Sanofi: information concerning the total number of voting rights and shares, March 2020
- Sanofi: Annual General Meeting of April 28, 2020
- Sanofi at forefront of fight against COVID-19 in Q1 2020
- FDA approves MenQuadfiTM, the latest innovation in meningococcal (MenACWY) vaccination
- Sanofi brain-penetrant BTK inhibitor significantly reduced disease activity in Phase 2 trial in relapsing multiple sclerosis
About author

Online


Add a comment
Comments
0 comments on the analysis SANOFI - Weekly