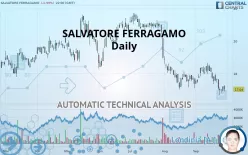
SALVATORE FERRAGAMO - Daily - Technical analysis published on 09/30/2019 (GMT)
- 193
- 0
- Who voted?
Click here for a new analysis!
- Timeframe : Daily
- - Analysis generated on
- Status : TARGET REACHED

Summary of the analysis

Additional analysis
Quotes
The SALVATORE FERRAGAMO price is 17.040 EUR. The price is lower by -0.99% since the last closing and was between 16.910 EUR and 17.285 EUR. This implies that the price is at +0.77% from its lowest and at -1.42% from its highest.The Central Gaps scanner detects a bearish opening. A small advantage for sellers in the very short term.
Bearish opening
Type : Bearish
Timeframe : Openning
A study of price movements over other periods shows the following variations:
Near a new LOW record (5 years)
Type : Bearish
Timeframe : Weekly
Near a new LOW record (1 year)
Type : Bearish
Timeframe : Weekly
Near a new LOW record (1st january)
Type : Bearish
Timeframe : Weekly
Near a new LOW record (1 month)
Type : Bearish
Timeframe : Weekly
Technical
A technical analysis in Daily of this SALVATORE FERRAGAMO chart shows a sharp bearish trend. 92.86% of the signals given by moving averages are bearish. The overall trend is supported by the strong bearish signals from short-term moving averages. The Central Indicators market scanner currently does not detect any result that concerns moving averages.
An assessment of technical indicators does not currently provide any relevant information on the direction of future price movements.
Caution: the Central Indicators scanner currently detects an excess:
CCI indicator is oversold : under -100
Type : Neutral
Timeframe : Daily
Williams %R indicator is oversold : under -80
Type : Neutral
Timeframe : Daily
Pivot points : price is under support 3
Type : Neutral
Timeframe : Weekly
Price is back over the pivot point
Type : Bullish
Timeframe : Weekly
The analysis of the price chart with Central Patterns scanners does not return any result.
The Central Candlesticks scanner, specialised in Japanese candlesticks, did not identify any signals.
| Price | R1 | R2 | R3 | |
|---|---|---|---|---|
| ProTrendLines | 17.040 | 17.158 | 18.017 | 18.763 |
| Change (%) | - | +0.69% | +5.73% | +10.11% |
| Change | - | +0.118 | +0.977 | +1.723 |
| Level | - | Major | Major | Intermediate |
To determine price objectives, it is also possible to use the pivot points. Here is the price position in relation to pivot points:
| Pivot points | S3 | S2 | S1 | PP | R1 | R2 | R3 |
|---|---|---|---|---|---|---|---|
| Standard | 16.287 | 16.478 | 16.762 | 16.953 | 17.237 | 17.428 | 17.712 |
| Camarilla | 16.914 | 16.958 | 17.002 | 17.045 | 17.089 | 17.132 | 17.176 |
| Woodie | 16.333 | 16.501 | 16.808 | 16.976 | 17.283 | 17.451 | 17.758 |
| Fibonacci | 16.478 | 16.660 | 16.772 | 16.953 | 17.135 | 17.247 | 17.428 |
| Pivot points | S3 | S2 | S1 | PP | R1 | R2 | R3 |
|---|---|---|---|---|---|---|---|
| Standard | 17.367 | 17.663 | 18.057 | 18.353 | 18.747 | 19.043 | 19.437 |
| Camarilla | 18.260 | 18.324 | 18.387 | 18.450 | 18.513 | 18.577 | 18.640 |
| Woodie | 17.415 | 17.688 | 18.105 | 18.378 | 18.795 | 19.068 | 19.485 |
| Fibonacci | 17.663 | 17.927 | 18.090 | 18.353 | 18.617 | 18.780 | 19.043 |
| Pivot points | S3 | S2 | S1 | PP | R1 | R2 | R3 |
|---|---|---|---|---|---|---|---|
| Standard | 14.502 | 15.753 | 16.562 | 17.813 | 18.622 | 19.873 | 20.682 |
| Camarilla | 16.804 | 16.992 | 17.181 | 17.370 | 17.559 | 17.748 | 17.937 |
| Woodie | 14.280 | 15.643 | 16.340 | 17.703 | 18.400 | 19.763 | 20.460 |
| Fibonacci | 15.753 | 16.540 | 17.026 | 17.813 | 18.600 | 19.086 | 19.873 |
Numerical data
The following are the details of the technical indicators and moving averages that were collected to generate this technical analysis:
| RSI (14): | 34.02 | |
| MACD (12,26,9): | -0.3090 | |
| Directional Movement: | -21.521 | |
| AROON (14): | -57.143 | |
| DEMA (21): | 17.333 | |
| Parabolic SAR (0,02-0,02-0,2): | 18.257 | |
| Elder Ray (13): | -0.652 | |
| Super Trend (3,10): | 18.190 | |
| Zig ZAG (10): | 16.990 | |
| VORTEX (21): | 0.8770 | |
| Stochastique (14,3,5): | 13.42 | |
| TEMA (21): | 17.372 | |
| Williams %R (14): | -83.84 | |
| Chande Momentum Oscillator (20): | -1.130 | |
| Repulse (5,40,3): | -0.8730 | |
| ROCnROLL: | 2 | |
| TRIX (15,9): | -0.1770 | |
| Courbe Coppock: | 4.81 |
| MA7: | 17.409 | |
| MA20: | 17.794 | |
| MA50: | 18.496 | |
| MA100: | 19.446 | |
| MAexp7: | 17.369 | |
| MAexp20: | 17.737 | |
| MAexp50: | 18.366 | |
| MAexp100: | 18.894 | |
| Price / MA7: | -2.12% | |
| Price / MA20: | -4.24% | |
| Price / MA50: | -7.87% | |
| Price / MA100: | -12.37% | |
| Price / MAexp7: | -1.89% | |
| Price / MAexp20: | -3.93% | |
| Price / MAexp50: | -7.22% | |
| Price / MAexp100: | -9.81% |
News
The last news published on SALVATORE FERRAGAMO at the time of the generation of this analysis was as follows:
- Salvatore Ferragamo of Il Borro Wines to Host Admiral Travel Charter of Crystal Skye Boeing 777 Private Jet
-
 Salvatore Ferragamo
-
Salvatore Ferragamo
-
Salvatore Ferragamo
About author

Online


Add a comment
Comments
0 comments on the analysis SALVATORE FERRAGAMO - Daily