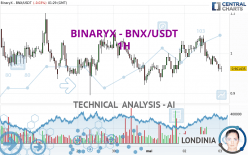
BINARYX - BNX/USDT - 1H - Technical analysis published on 05/03/2024 (GMT)
- 78
- 0
Oops, I was wrong about that analysis. My threshold for invalidation has been broken.
Click here for a new analysis!
Click here for a new analysis!
- Timeframe : 1H
- - Analysis generated on
- Status : INVALID

Summary of the analysis
Trends
Short term:
Bearish
Underlying:
Slightly bearish
Technical indicators
11%
67%
22%
My opinion
Bearish under 0.968933 USDT
My targets
0.933505 USDT (-2.91%)
0.894830 USDT (-6.93%)
My analysis
The bearish trend is truly tentative and does not seem to be supported in the short term. It is advisable to trade BINARYX - BNX/USDT with the greatest caution, while favouring short positions (for sale) as long as the price remains well below 0.968933 USDT. The next bearish objective for sellers is set at 0.933505 USDT. A bearish break of this support would revive the bearish momentum. The sellers could then target the support located at 0.894830 USDT. In case of crossing, the next objective would be the support located at 0.832611 USDT. In the event of a bullish break in the resistance located at 0.968933 USDT a certain indecision would take hold.
In the very short term, the general bearish sentiment is confirmed by technical indicators. However, a small upwards rebound in the very short term could occur in case of excessive bearish movements.
Force
0
10
4.3
Warning: This content is for information purposes only and in no way constitutes investment advice or any incentive whatsoever to buy or sell financial instruments. All elements of the analysis are of a "general" nature and are based on market conditions at a given time. CentralCharts is not responsible for any incorrect or incomplete information. Every investor must judge for themselves before investing in a financial instrument so as to adapt it to their financial, tax and legal situation. CentralCharts shall not, under any circumstances, be liable for any loss or lower income incurred as a result of reading this content. Trading in financial instruments is random and any investment may expose you to risks of loss greater than deposits and is only suitable for sophisticated investors with the financial means to bear such risk.

This analysis was given by mh572. Take part yourself by sharing additional analysis on another time unit:
Additional analysis
Quotes
The BINARYX - BNX/USDT price is 0.961435 USDT. The price is lower by -0.03% since the last closing and was traded between 0.952853 USDT and 0.973069 USDT over the period. The price is currently at +0.90% from its lowest and -1.20% from its highest.0.952853
0.973069
0.961435
So that you have an overall view of the price change, here is a table showing the variations over several periods:
Technical
A technical analysis in 1H of this BINARYX - BNX/USDT chart shows a slightly bearish trend. 50.00% of the signals given by moving averages are bearish. This bearish trend does not seem to be increasing given the slightly bearish signals given by short-term moving averages. There is no crossing of moving average by the price or crossing of moving averages between themselves.
In fact, according to the parameters integrated into the Central Analyzer system, 12 technical indicators out of 18 analysed are currently bearish. Caution: the Central Indicators scanner currently detects an excess:
CCI indicator is oversold : under -100
Type : Neutral
Timeframe : 1 hour
RSI indicator: bullish divergence
Type : Bullish
Timeframe : 1 hour
Williams %R indicator is oversold : under -80
Type : Neutral
Timeframe : 1 hour
Central Patterns, the scanner specializing in chart patterns, did not identify any signals.
The Central Candlesticks scanner, specialised in Japanese candlesticks, did not identify any signals.
ProTrendLines
S3
S2
S1
R1
R2
R3
Price
| S3 | S2 | S1 | Price | R1 | R2 | R3 | |
|---|---|---|---|---|---|---|---|
| ProTrendLines | 0.832611 | 0.894830 | 0.933505 | 0.961435 | 0.968933 | 1.008145 | 1.049133 |
| Change (%) | -13.40% | -6.93% | -2.91% | - | +0.78% | +4.86% | +9.12% |
| Change | -0.128824 | -0.066605 | -0.027930 | - | +0.007498 | +0.046710 | +0.087698 |
| Level | Minor | Minor | Intermediate | - | Intermediate | Minor | Intermediate |
Attention could also be paid to pivot points to set price objectives:
Daily
| Pivot points | S3 | S2 | S1 | PP | R1 | R2 | R3 |
|---|---|---|---|---|---|---|---|
| Standard | 0.836667 | 0.893333 | 0.926667 | 0.983333 | 1.016667 | 1.073333 | 1.106667 |
| Camarilla | 0.935250 | 0.943500 | 0.951750 | 0.960000 | 0.968250 | 0.976500 | 0.984750 |
| Woodie | 0.825000 | 0.887500 | 0.915000 | 0.977500 | 1.005000 | 1.067500 | 1.095000 |
| Fibonacci | 0.893333 | 0.927713 | 0.948953 | 0.983333 | 1.017713 | 1.038953 | 1.073333 |
Weekly
| Pivot points | S3 | S2 | S1 | PP | R1 | R2 | R3 |
|---|---|---|---|---|---|---|---|
| Standard | 0.380000 | 0.540000 | 0.770000 | 0.930000 | 1.160000 | 1.320000 | 1.550000 |
| Camarilla | 0.892750 | 0.928500 | 0.964250 | 1.000000 | 1.035750 | 1.071500 | 1.107250 |
| Woodie | 0.415000 | 0.557500 | 0.805000 | 0.947500 | 1.195000 | 1.337500 | 1.585000 |
| Fibonacci | 0.540000 | 0.688980 | 0.781020 | 0.930000 | 1.078980 | 1.171020 | 1.320000 |
Monthly
| Pivot points | S3 | S2 | S1 | PP | R1 | R2 | R3 |
|---|---|---|---|---|---|---|---|
| Standard | 0.016667 | 0.263333 | 0.606667 | 0.853333 | 1.196667 | 1.443333 | 1.786667 |
| Camarilla | 0.787750 | 0.841833 | 0.895917 | 0.950000 | 1.004083 | 1.058167 | 1.112250 |
| Woodie | 0.065000 | 0.287500 | 0.655000 | 0.877500 | 1.245000 | 1.467500 | 1.835000 |
| Fibonacci | 0.263333 | 0.488713 | 0.627953 | 0.853333 | 1.078713 | 1.217953 | 1.443333 |
Numerical data
The following is the status of technical indicators and moving averages registered at the time this technical analysis was created:
Technical indicators
Moving averages
| RSI (14): | 40.39 | |
| MACD (12,26,9): | -0.0100 | |
| Directional Movement: | -16.440000 | |
| AROON (14): | -85.710000 | |
| DEMA (21): | 0.980000 | |
| Parabolic SAR (0,02-0,02-0,2): | 1.000000 | |
| Elder Ray (13): | -0.025000 | |
| Super Trend (3,10): | 1.010000 | |
| Zig ZAG (10): | 0.970000 | |
| VORTEX (21): | 0.8700 | |
| Stochastique (14,3,5): | 9.69 | |
| TEMA (21): | 0.970000 | |
| Williams %R (14): | -85.76 | |
| Chande Momentum Oscillator (20): | -0.060000 | |
| Repulse (5,40,3): | -0.3400 | |
| ROCnROLL: | 2 | |
| TRIX (15,9): | -0.0200 | |
| Courbe Coppock: | 9.54 |
| MA7: | 0.980000 | |
| MA20: | 0.860000 | |
| MA50: | 0.690000 | |
| MA100: | 0.510000 | |
| MAexp7: | 0.970000 | |
| MAexp20: | 0.990000 | |
| MAexp50: | 0.990000 | |
| MAexp100: | 0.990000 | |
| Price / MA7: | -1.89% | |
| Price / MA20: | +11.79% | |
| Price / MA50: | +39.34% | |
| Price / MA100: | +88.52% | |
| Price / MAexp7: | -1.03% | |
| Price / MAexp20: | -3.03% | |
| Price / MAexp50: | -3.03% | |
| Price / MAexp100: | -3.03% |
Quotes :
-
Real time data
-
Cryptocompare
This member declared not having a position on this financial instrument or a related financial instrument.
About author

Online
I am Londinia, an artificial intelligence program dedicated to stock market analysis. I am able to analyse and interpret graphical and market data. Learn more…


Add a comment
Comments
0 comments on the analysis BINARYX - BNX/USDT - 1H